Volume 26, Number 11—November 2020
Research
Modeling Treatment Strategies to Inform Yaws Eradication
Figure 9
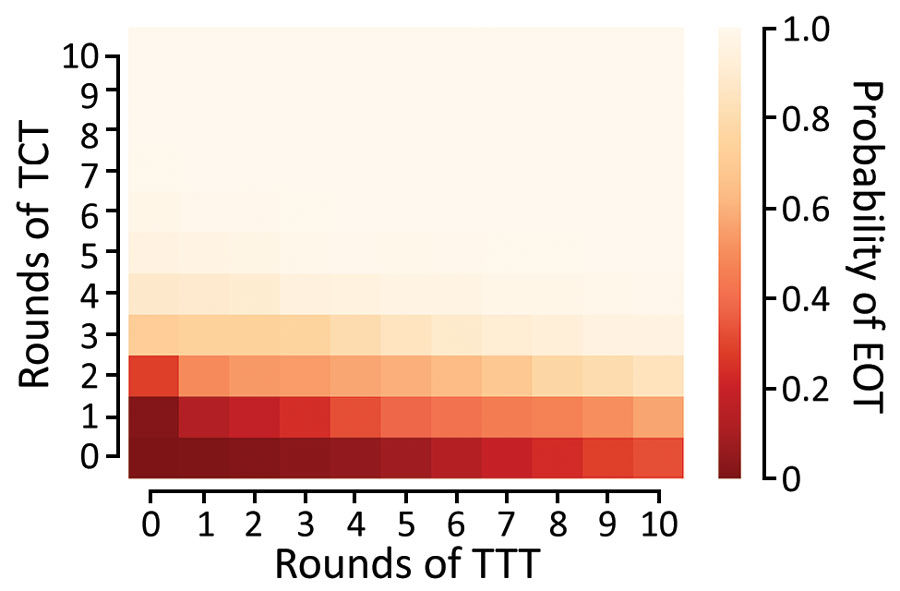
Figure 9. Probability of local elimination of transmission under different intervention strategies with varying numbers of rounds of TCT followed by rounds of TTT treating clinical case-patients and household contacts. Each rectangle in the figure represents a different strategy (consisting of some number of rounds of TCT followed by rounds of TTT). The color of the rectangle shows the probability of elimination of transmission, based on the color bar to the right. Each twice-yearly round of TCT has 80% coverage, whereas TTT has 100% coverage, and treatment is assumed to have 95% efficacy. An additional type of treatment round is administered once a month, giving treatment to 5% of infectious persons and their household contacts. Parameters are inferred from data collected from the Solomon Islands in 2013. TCT, total community treatment; TTT, total targeted treatment.