Volume 26, Number 7—July 2020
Research
Severe Acute Respiratory Syndrome Coronavirus 2−Specific Antibody Responses in Coronavirus Disease Patients
Figure 4
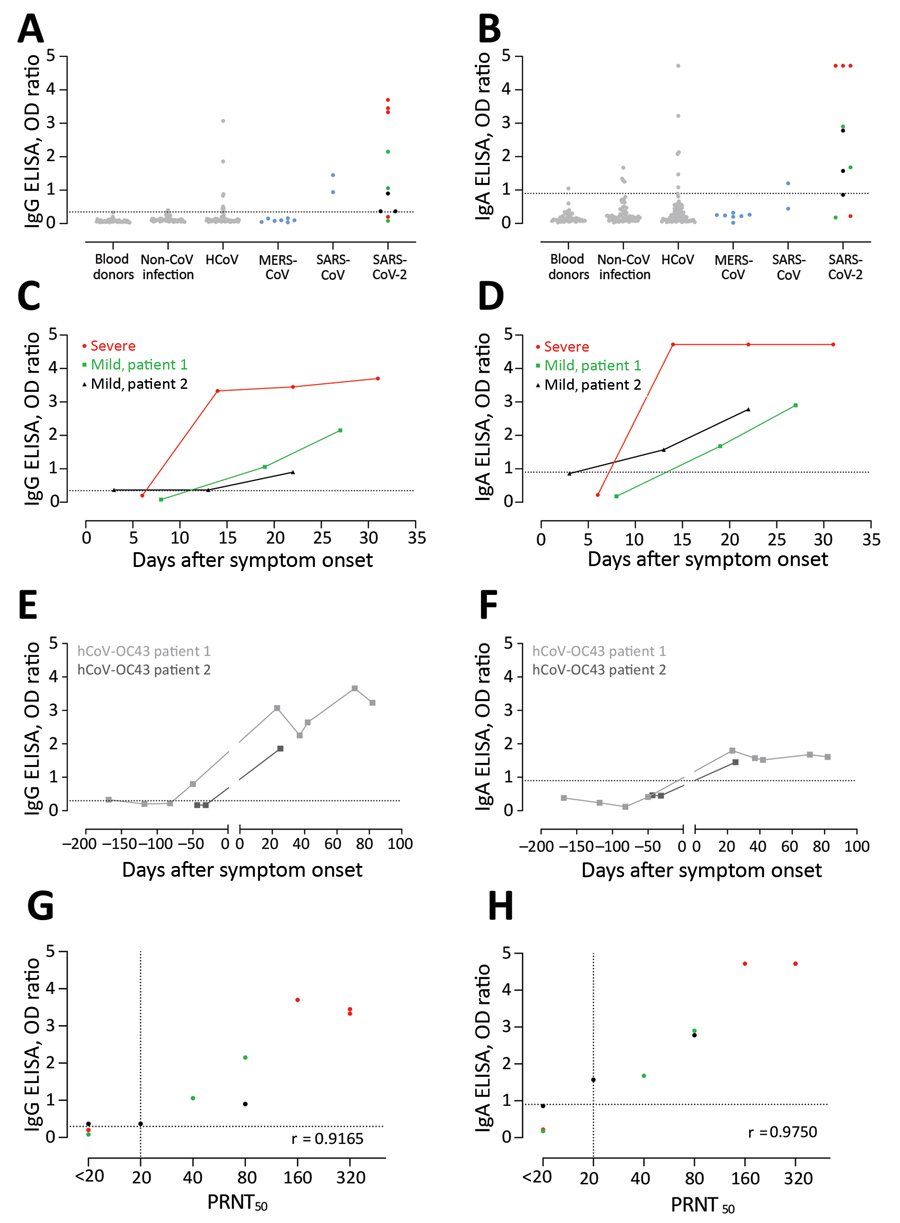
Figure 4. Validation of 2 commercial ELISAs for detection of SARS-CoV-2–specific IgG (A, C, E, G) and IgA (B, D, F, H). A, B) Validation of the specificity of the 2 ELISA platforms; C, D) kinetics of antibody responses in 3 COVID-19 patients; E, F) cross-reactivity of HCoV-OC43 serum samples in commercial platforms; G, H) correlation between antibody responses detected by the ELISAs and the plaque reduction neutralization assay. Gray dots indicate specificity cohorts A–C, including healthy blood donors (n = 45), non-CoV respiratory infections (n = 76), and HCoV infections (n = 75); blue dots indicate non-SARS-CoV-2 zoonotic coronavirus infections (i.e., MERS-CoV [n = 7] and SARS-CoV [n = 2]); red dots indicate patients with severe COVID-19; and green and black dots indicate patients with mild COVID-19. Dotted horizontal lines indicate ELISA cutoff values. CoV, coronavirus; COVID-19, coronavirus disease 2019; HCoV, human coronavirus; MERS-CoV, Middle East respiratory syndrome coronavirus; N, nucleocapsid; OD, optical density; PRNT50, plaque reduction neutralization assay; RBD, receptor-binding domain; RFU, relative fluorescence unit; S, spike; SARS-CoV-2; severe acute respiratory syndrome coronavirus 2.
1These authors contributed equally to this article.