Volume 26, Number 8—August 2020
Synopsis
US CDC Real-Time Reverse Transcription PCR Panel for Detection of Severe Acute Respiratory Syndrome Coronavirus 2
Xiaoyan Lu, Lijuan Wang, Senthilkumar K. Sakthivel, Brett Whitaker, Janna Murray, Shifaq Kamili, Brian Lynch, Lakshmi Malapati, Stephen A. Burke, Jennifer Harcourt, Azaibi Tamin, Natalie J. Thornburg, Julie M. Villanueva, and Stephen Lindstrom
Figure 1
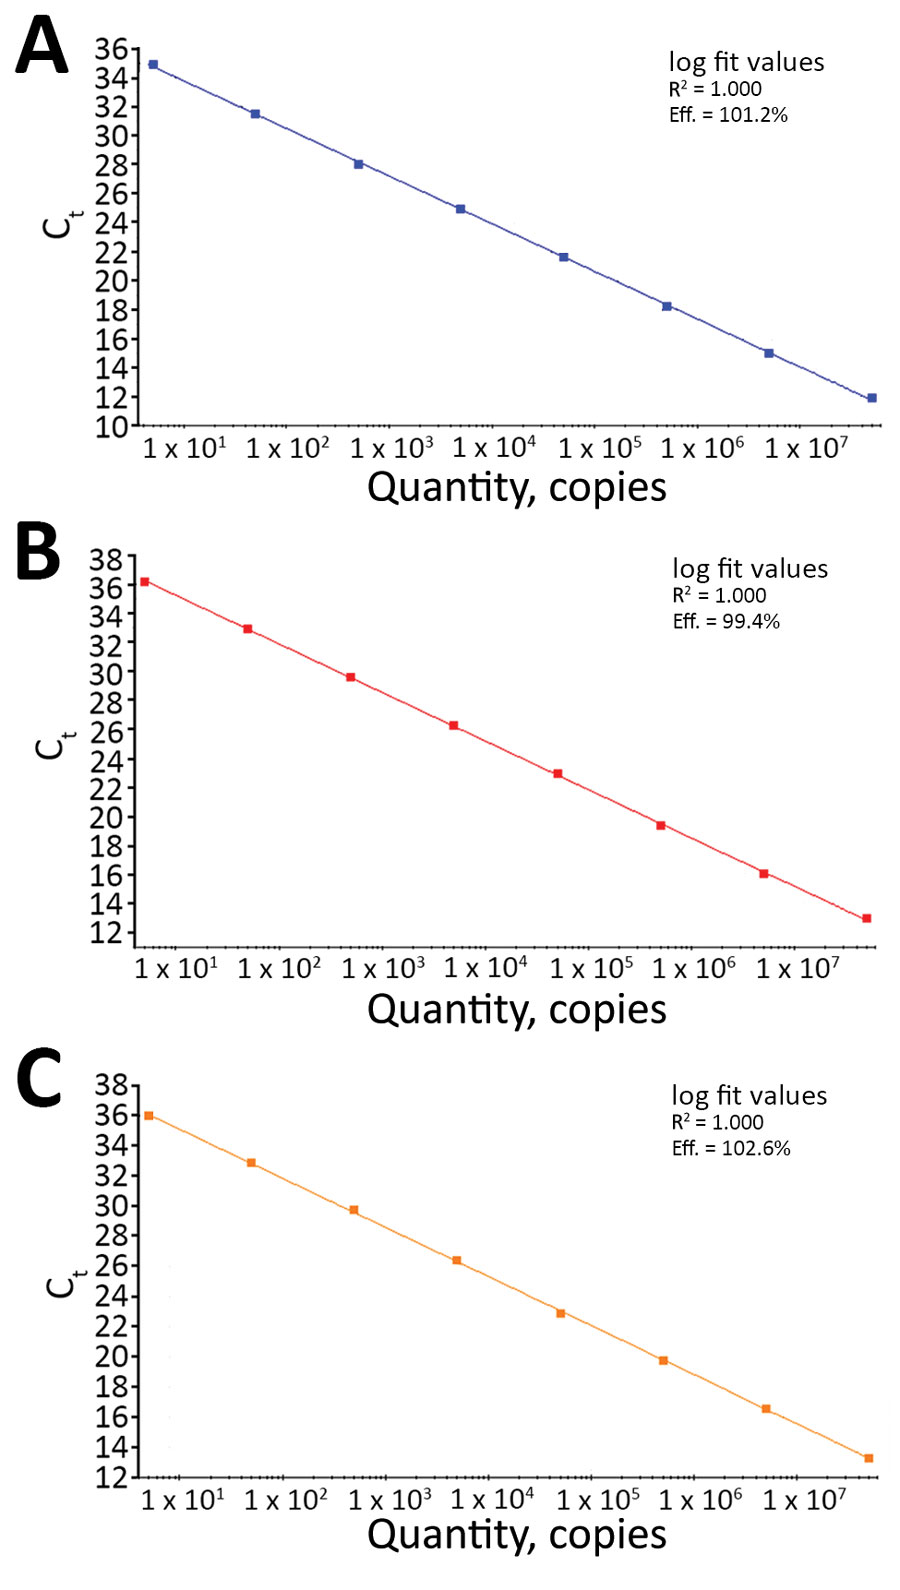
Figure 1. Linear regression analysis of serial 10-fold dilutions of synthetic RNA transcripts of the nucleocapsid gene (N) ranging from 5 to 5 × 10⁷ copies/reaction tested by the N1 (A), N2 (B), and N3 (C) assays in the US Centers for Disease Control and Prevention real-time reverse transcription PCR panel for detection of severe acute respiratory syndrome coronavirus 2. For each assay, R2 indicates calculated linear correlation coefficients and eff. indicates amplification efficiencies. Ct, cycle threshold.
Page created: May 14, 2020
Page updated: July 17, 2020
Page reviewed: July 17, 2020
The conclusions, findings, and opinions expressed by authors contributing to this journal do not necessarily reflect the official position of the U.S. Department of Health and Human Services, the Public Health Service, the Centers for Disease Control and Prevention, or the authors' affiliated institutions. Use of trade names is for identification only and does not imply endorsement by any of the groups named above.