Skip directly to site content Skip directly to page options Skip directly to A-Z link Skip directly to A-Z link Skip directly to A-Z link
Volume 27, Number 9—September 2021
Research

Reduction in Antimicrobial Use and Resistance to Salmonella, Campylobacter, and Escherichia coli in Broiler Chickens, Canada, 2013–2019

Laura HuberComments to Author , Agnes Agunos, Sheryl P. Gow, Carolee A. Carson, and Thomas P. Van Boeckel
Author affiliations: Auburn University, Auburn, Alabama, USA (L. Huber); ETH Zürich, Zürich, Switzerland (L. Huber, T.P. Van Boeckel); Public Health Agency of Canada, Guelph, Ontario, Canada (A. Agunos, C.A. Carson); Public Health Agency of Canada, Saskatoon, Saskatchewan, Canada (S.P. Gow); Center for Disease Dynamics, Economics & Policy, Washington, DC, USA (T.P. Van Boeckel)

Main Article

Figure 1

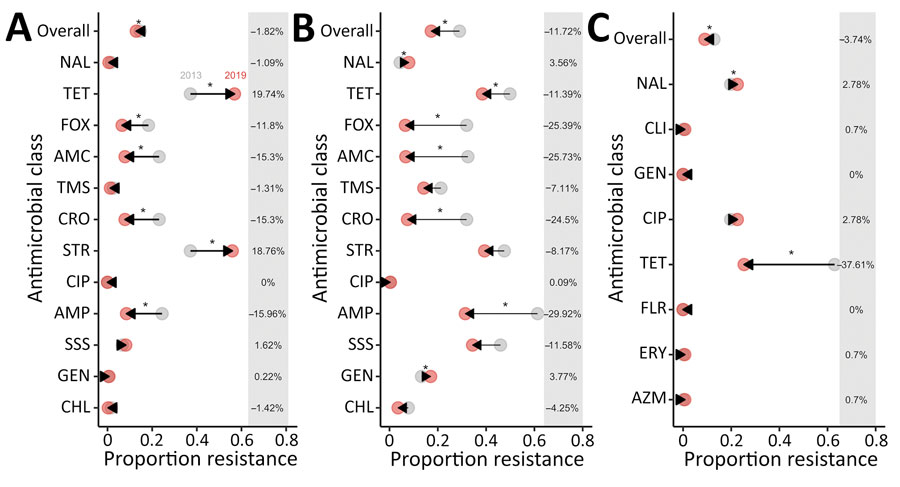
Change in mean proportion of antimicrobial resistance in Salmonella (A), Escherichia coli (B), and Campylobacter (C) in in broiler chickens, overall and by drug class, Canada, 2013–2019. Arrows represent directionality of proportion change in resistance from 2013 (gray) to 2019 (red) for each of the antimicrobial classes. Differences in proportion resistance from 2013 to 2019 are presented on the right side of each graph. Asterisks indicate p<0.05 as determined by mixed-effects logistic regression, including year and antimicrobial use (in ovo or through subcutaneous injection, water, and feed) as fixed effects and flock and veterinarian identification as random effects. AMC, amoxicillin/clavulanic acid; AMP, ampicillin; AZM, azithromycin; CHL, chloramphenicol; CIP, ciprofloxacin; CLI, clindamycin; CRO, ceftriaxone; ERY, erythromycin; FLR, florfenicol; FOX, cefoxitin; GEN, gentamycin; NAL, nalidixic acid; SSS, sulfisoxazole; STR, streptomycin; TET, tetracycline; TMS, trimethropim/sulfonamides.

Figure 1. Change in mean proportion of antimicrobial resistance in Salmonella (A), Escherichia coli (B), and Campylobacter (C) in in broiler chickens, overall and by drug class, Canada, 2013–2019. Arrows represent directionality of proportion change in resistance from 2013 (gray) to 2019 (red) for each of the antimicrobial classes. Differences in proportion resistance from 2013 to 2019 are presented on the right side of each graph. Asterisks indicate p<0.05 as determined by mixed-effects logistic regression, including year and antimicrobial use (in ovo or through subcutaneous injection, water, and feed) as fixed effects and flock and veterinarian identification as random effects. AMC, amoxicillin/clavulanic acid; AMP, ampicillin; AZM, azithromycin; CHL, chloramphenicol; CIP, ciprofloxacin; CLI, clindamycin; CRO, ceftriaxone; ERY, erythromycin; FLR, florfenicol; FOX, cefoxitin; GEN, gentamycin; NAL, nalidixic acid; SSS, sulfisoxazole; STR, streptomycin; TET, tetracycline; TMS, trimethropim/sulfonamides.

Main Article

Page created: July 14, 2021
Page updated: August 17, 2021
Page reviewed: August 17, 2021
The conclusions, findings, and opinions expressed by authors contributing to this journal do not necessarily reflect the official position of the U.S. Department of Health and Human Services, the Public Health Service, the Centers for Disease Control and Prevention, or the authors' affiliated institutions. Use of trade names is for identification only and does not imply endorsement by any of the groups named above.
file_external