Volume 27, Number 9—September 2021
Research
Reduction in Antimicrobial Use and Resistance to Salmonella, Campylobacter, and Escherichia coli in Broiler Chickens, Canada, 2013–2019
Cite This Article
Citation for Media
Abstract
Antimicrobial use contributes to the global rise of antimicrobial resistance (AMR). In 2014, the poultry industry in Canada initiated its Antimicrobial Use Reduction Strategy to mitigate AMR in the poultry sector. We monitored trends in antimicrobial use and AMR of foodborne bacteria (Salmonella, Escherichia coli, and Campylobacter) in broiler chickens during 2013 and 2019. We quantified the effect of antimicrobial use and management factors on AMR by using LASSO regression and generalized mixed-effect models. AMR in broiler chickens declined by 6%–38% after the decrease in prophylactic antimicrobial use. However, the withdrawal of individual compounds, such as cephalosporins and fluoroquinolones, prompted an increase in use of and resistance levels for other drug classes, such as aminoglycosides. Canada’s experience with antimicrobial use reduction illustrates the potential for progressive transitions from conventional antimicrobial-dependent broiler production to more sustainable production with respect to antimicrobial use.
In Canada, foodborne pathogens cause an estimated 4 million cases of human illness, 11,600 hospitalizations, and 238 deaths each year (1). Escherichia coli, Campylobacter, and Salmonella are the foodborne zoonotic pathogens most frequently associated with infections from poultry products (2). Antimicrobial drugs have been used in ovo, feed, or water to prevent or treat commonly occurring diseases of poultry and to enable gains in productivity on farms (3,4). However, use of antimicrobial drugs contributes to the development of antimicrobial resistance (AMR). In humans, treatment of salmonellosis with antimicrobial drugs is often unnecessary but may be life-saving in the case of invasive infections (5). The rise of AMR progressively reduces the number of antimicrobial drug options available to treat infections, which has important consequences for human health but also for the long-term viability of the production of animals (6–8).
In 2005, the Canadian Integrated Program for Antimicrobial Resistance Surveillance (CIPARS) reported an increasing frequency of resistance to ceftiofur, a veterinary third-generation cephalosporin (9), in Salmonella enterica serovar Heidelberg isolates from retail chicken and humans (10). In response, broiler chicken producers in Québec Province voluntarily eliminated the extra-label use of ceftiofur through injection (in ovo or subcutaneously) in hatcheries (11). By 2006, this measure led to a reduction in prevalence of ceftiofur-resistant Salmonella Heidelberg in retail chicken and humans (8). In a concerted effort to mitigate AMR and to reduce overall antimicrobial use (AMU), a stewardship program called the Antimicrobial Use Reduction Strategy was initiated in 2014 by the poultry industry. The first objective of this program was the elimination of the preventive use of Health Canada’s Veterinary Drugs Directorate’ category I antimicrobials (12), including third-generation cephalosporins (e.g., ceftiofur) and fluoroquinolones, which was accomplished in 2014 (13). Subsequently, the goal was to eliminate the preventive use of category II antimicrobials (e.g., aminoglycosides, lincosamides-aminocyclitols, macrolides, penicillin, and trimethoprim/sulfonamide combinations), which was accomplished in the end of 2018. The third phase was to include the elimination of the preventive use of category III antimicrobials (e.g., bacitracins and tetracyclines) by the end of 2020 (13). This third step has been postponed pending further consultation with producers, an assessment of overall bird health and welfare from implementation of the first 2 phases, and a more fulsome evaluation of the production outcomes.
In our study, we used farm-level AMU and AMR time series data from CIPARS (2013–2019) to identify how changes in AMU have affected AMR in E. coli, Campylobacter, and Salmonella isolates from broiler chicken farms in Canada. The specific goals were to assess trends in AMR by province during 2013–2019, identify farm-management factors affecting AMU and AMR, and examine the association between route of antimicrobial administration (injections, water, or feed) and the frequency of multidrug resistance (defined as resistance to >2 antimicrobial classes).
Study Design and Data Collection
We collected AMU and AMR information at the farm level through a network of poultry veterinarians (n = 17) who were assigned to producers (n = 97–147, depending on the year) in the 5 major poultry-producing provinces of Canada: British Columbia, Alberta, Saskatchewan, Ontario, and Québec (14). Participating producers signed an informed consent form, which was administered by the veterinarian. We obtained information on farm-level AMU and farm demographics by using a questionnaire and collected fecal samples for bacterial recovery and antimicrobial-susceptibility testing. We collected samples according to the formula for detection of AMR in a population of >1,000 individuals (n = ln α / ln [1 – minimum expected prevalence]; α = 0.05) (15), according to the routine CIPARS/FoodNet Canada farm sampling strategy. We divided each barn from each farm in 4 quadrants, and we collected 10–15 fresh fecal droppings from each quadrant. We pooled the samples from each quadrant and selected randomly 1 isolate per pooled sample for all E. coli, Salmonella, and Campylobacter for further analysis. Each year, we sampled 1 flock of preharvest broilers (>30 days old) that had been randomly selected from each production unit. We administered questionnaires to record flock characteristics, including hatchery or province and country of origin of the hatching eggs or chicks, breed, production system (conventional or antimicrobial-free), age, and estimated weight of birds at preharvest sampling. We collected detailed AMU information, including the quantity of antimicrobial active ingredients administered, routes of administration (in ovo or subcutaneous injections at the hatchery, feed, and water) and primary reasons for use of antimicrobial (prophylaxis, growth promotion, or disease treatment). We also collected information on biosecurity, health status, and vaccination history (questionnaires were published elsewhere [16] as supplemental material).
Bacteria Isolation and Susceptibility Testing
When an isolate of each bacterial species of interest (Salmonella, E. coli and Campylobacter) was identified, we saved that isolate and tested it for susceptibility. We conducted antimicrobial-susceptibility testing by using routine CIPARS methodology (14). We performed automated broth microdilution by using Sensititre (ThermoFisher Scientific, https://www.thermofisher.com) using the CMV4AGNF panel for Salmonella and E. coli and the CAMPY plates for Campylobacter. Plate configurations were designed by the US National Antimicrobial Resistance Monitoring System. We applied Clinical and Laboratory Standards Institute breakpoint guidelines (17,18) (Appendix Table 1). According to routine CIPARS/National Antimicrobial Resistance Monitoring System methods, we classified isolates with intermediate susceptibility patterns as susceptible. According to CIPARS AMR testing methods, we sued no selective media in this study.
Statistical Analysis
The number of antimicrobial classes each isolate was resistant to (nC) was the main outcome in the regression models. We evaluated the effect of covariates on the nC by using a 2-step procedure. First, we used a LASSO regression to select a subset of risk factors to be included in the generalized models (Appendix Table 2). Second, we ran a mixed-effect model with veterinarian and flock identification as random effects in all models. We cross-validated the models by dividing the dataset into 3 validation sets.
The term “ideal method for cleaning and disinfection” refers to the method recommended by the World Organisation for Animal Health (OIE) (19) aimed at reducing infectious pathogens in animal premises. This method consists of dry cleaning (i.e., removing of all equipment and brushing and scraping all surfaces), followed by a warm water (60°C) wash and application of a disinfectant to reduce microbial populations and carry over of pathogens to the next production cycle. For production system categories, the term “antimicrobial-free”(in contrast with “conventional” refers to farms that were not exposed to nationally defined medically important antimicrobials (20) or farms that have a reduced AMU program (i.e., one that may allow use of chemical coccidiostats, according to guidelines [21], or ionophores). We estimated AMU at the flock level in milligrams of antimicrobial active ingredient per kilogram broiler chicken biomass (mg/kg) by summing of all antimicrobials reportedly used in the flock from all routes of administration and dividing by the live animal biomass (e.g., birds at risk multiplied by the average preslaughter live weight) (22).
We compared the model fit between models by using the Akaike information criteria and the likelihood ratio test. We performed post hoc pairwise testing of mean flock differences in nC among groups of disinfection method, use of antimicrobials at the hatcheries, year, and province by using Tukey’s multiple comparison test.
We quantified the trends of antimicrobial use (Appendix Figures 2–4 for Salmonella, 8–10 for E. coli, and 14–16 for Campylobacter), and the association between resistance for individual antimicrobial classes (Appendix Figures 5–7 for Salmonella, 11–13 for E. coli, and 17–19 for Campylobacter) by using mixed-effect logistic regression models for each bacterial species. We conducted all statistical analysis in RStudio 1.2.5033 (https://www.rstudio.com) and defined statistical significance as p<0.05.
Temporal Differences, Regional Differences, and Factors Associated with AMR
For Salmonella, the nC an isolate was resistant to in 2018 was 0.9 times lower than the nC an isolate was resistant to in 2013 (p<0.001); however, the nC an isolate was resistant to in 2019 was 1.6 times higher than in 2013 (p = 0.045), given that other variables were held constant in the model. In individual provinces, compared with the value for Alberta, the nC an isolate was resistant to was 1.7 times higher in British Columbia (p = 0.007), 1.8 times higher in Ontario (p = 0.002), 3.8 times higher in Québec (p<0.001), and 1.9 times higher in Saskatchewan (p = 0.009). For every 1-unit increase in antimicrobial injected in ovo (mg/kg) in the hatcheries, the national nC an isolate was resistant to increased by 3.4 (p = 0.02). Posthoc (Tukey test) showed that Ontario (p = 0.015) and Québec (p<0.001) had a significantly higher mean nC that an isolate was resistant to compared with Alberta; Québec also had a significantly higher mean nC that an isolate was resistant to than British Columbia and Ontario across all years (p<0.001 for both provinces) (Table 1). The antibiotic-free flocks (n = 286) were not different from conventional flocks (n = 1,612) in the nC an isolate was resistant to (Table 1). However, prevalence of Salmonella Heidelberg was statistically significantly higher at conventional farms (Appendix Figure 1). Using the ideal method of disinfection, which that entails dry and wet cleaning followed by the application of a disinfectant, was not a significant factor in the nC a Salmonella isolate was resistant to. However, significantly higher prevalence of Salmonella Heidelberg and Kentucky (Appendix Figure 1) was found in flocks that did not use the ideal method of disinfection.
For E. coli, nationally, during 2018 and 2019, the nC an isolate was resistant to was 0.9 (in 2018, p = 0.015) and 0.8 (in 2019, p<0.001) times lower than the nC an isolate was resistant to in 2013 after controlling for other variables (Table 2). The nC an isolate was resistant to was 1.2 times higher in British Columbia (p = 0.032) and 1.4 times higher in Québec (p<0.001) than the nC an isolate was resistant to in Alberta; in Saskatchewan, the nC an isolate was resistant to was 0.5 times lower than in Alberta (p<0.001). Posthoc (Tukey test) examination demonstrated that the provinces of British Columbia, Ontario, Québec, and Saskatchewan had a significantly higher mean nC an isolate was resistant to compared with Alberta; Québec also had a significantly higher mean nC an isolate was resistant to than the means for British Columbia and Ontario. In 2019, we observed a significantly lower nC an isolate was resistant to than in 2013 (p = 0.002), 2014 (p = 0.002), 2015 (p = 0.012), and 2016 (p = 0.014) (Table 2). The antibiotic-free status of the flock and ideal method of disinfection were not significant factors in the nC to which an E. coli isolate was resistant.
For Campylobacter, in 2016, the nC to which an isolate was resistant was 0.4 times lower than the nC for 2013, given that other variables were held constant in the model (p = 0.03). Posthoc (Tukey test) comparison shows that 2016 (p = 0.008) and 2018 (p = 0.037) had a significantly lower mean nC to which an isolate was resistant than the value for 2015 (Table 3). The antibiotic-free status of the flock and ideal method of disinfection were not significant factors in the nC to which a Campylobacter isolate was resistant.
Prevalence of Resistance by Antimicrobial Drug
Prevalence of resistance remained <15% (Appendix Table 1) for 10 of 13 tested antimicrobials for Salmonella isolates (n = 1,898), 7 of 13 tested antimicrobials for E. coli isolates (n = 3,671), and 5 of 8 tested antimicrobials for Campylobacter isolates (n = 769). The prevalence of Salmonella isolates resistant to tetracycline was 44.7% (95% CI 42.5%–46.9%) and to streptomycin was 43.6% (95% CI 41.3%–45.8%) (Appendix Table 1). Moreover, prevalence of E.coli isolates resistant to tetracycline was 46.8% (95% CI 45.2%–48.4%), to streptomycin was 46.3% (95% CI 44.7%–47.9%), to sulfisoxazole was 39.4% (95% CI 37.8%–41.0%), to ampicillin was 40.5% (95% CI 38.9%–42.1%), to gentamicin was 18.4% (95% CI 17.2%–19.7%), and to trimethoprim/sulfamethoxazole was 16.1% (95% CI 14.9%–17.3%) (Appendix Table 1). The prevalence of Campylobacter isolates resistant to tetracycline was 38.8% (95% CI 35.3%–42.2%), to ciprofloxacin was 16.5% (95% CI 13.9%–19.1%), and to nalidixic acid was 16.4% (95% CI 13.8%–19.0%) (Appendix Table 1).
Temporal Trend of AMR by Antimicrobial Class
Figure 1
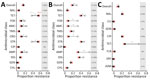
Figure 1. Change in mean proportion of antimicrobial resistance in Salmonella (A), Escherichia coli (B), and Campylobacter(C) in in broiler chickens, overall and by drug class,...
Figure 2
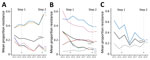
Figure 2. Significant changes (p<0.05) in mean proportion of antimicrobial resistance in Salmonella (A), Escherichia coli (B), and Campylobacter(C) in in broiler chickens, by antimicrobial class,...
For Salmonella, we observed a significant decrease in the mean resistance rates across all antimicrobial drugs included in the panel (1.8%), as well as individually to to cefoxitin (11.8%), amoxicillin/clavulanic acid (15.3%), ceftriaxone (15.3%), and ampicillin (15.9%) during 2013–2019. However, AMR rose significantly in streptomycin (18.8%) and tetracycline (19.7%) during the same period (Figures 1, 2). For E. coli, we observed a significant decrease in resistance overall (11.7%), as well as individually to tetracycline (11.4%), cefoxitin (25.4%), amoxicillin/clavulanic acid (25.7%), ceftriaxone (24.5%), and ampicillin (29.9%), whereas resistance to gentamicin (3.8%) and nalidixic acid (3.6%) increased (Figures 1, 2). For Campylobacter, we observed a significant decrease in overall (3.7%) resistance and to tetracycline (37.6%), but we observed a significant increase in nalidixic acid resistance (2.8%) (Figures 1, 2).
Temporal Trend of Antimicrobial Use by Class
Figure 3
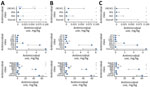
Figure 3. Mean antimicrobial use among broiler chicken flocks by bacterial species and route of administration, Canada, 2013–2019. A) Salmonella; B) Escherichia coli; C) Campylobacter.Route of...
Figure 4
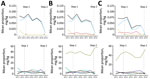
Figure 4. Mean antimicrobial use administered in ovo or subcutaneously at broiler chicken hatcheries or through feed, by isolation of bacterial species, Canada, 2013–2019. A) Salmonella; B) Escherichia coli...
In flocks where Salmonella was isolated, we observed a significant decrease in overall AMU, use of lincosamide-aminocyclitol combinations, and use of third-generation cephalosporins through injection (in ovo or subcutaneous routes) during 2013–2019 (Figures 3, 4; Appendix Figures 3, 4). For feed, we observed a statistically significant decrease in the use of macrolides, penicillins, streptogramins, but we observed a significant increase in the use of orthosomycins (Figures 3, 4; Appendix Figure 4). In flocks where E. coli was isolated, we observed a significant decrease in injectable antimicrobials during 2013–2019 (Figures 3, 4; Appendix Figure 8). We observed a decrease in the use of penicillins and streptogramins and an increase in the use of bacitracins and orthosomycins through feed over time (Figures 3, 4; Appendix Figure 10). In flocks where Campylobacter was isolated, we observed a significant decrease in overall injectable antimicrobials during 2013–2019 (Figures 3, 4; Appendix Figure 14). For feed, we observed a decrease in the use of macrolides, penicillins, streptogramins, and a significant increase in the use of bacitracins and orthosomycins (Figures 3, 4; Appendix Figure 16).
Antimicrobial Use and AMR Analysis by Antimicrobial Class
Figure 5
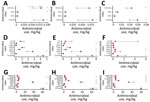
Figure 5. Mean antimicrobial use through injection, water, and feed in broiler chicken flocks where Salmonella, Escherichia coli, and Campylobacter were isolated, Canada, 2013–2019. A) ...
Flocks from which multidrug-resistant (MDR) Salmonella was isolated (n = 79 of 604 total flocks) had significantly higher median overall AMU compared with flocks where no MDR Salmonella was identified. Specifically, MDR flocks had significantly higher use of injectable lincosamide-aminocyclitol combinations (Figure 5; Appendix Figure 5), penicillins through water (Figure 5; Appendix Figure 6), and penicillins and tetracyclines through feed (Figure 5; Appendix Figure 7). Flocks from which MDR E. coli was isolated (n = 444/928) also had significantly higher median overall AMU. Most important, these flocks had significantly higher use of lincosamide-aminocyclitol combinations in ovo or subcutaneously at the hatcheries (Figure 5; Appendix Figure 11); tetracyclines, aminoglycosides, and penicillins through water (Figure 5; Appendix Figure 12); and penicillins, trimethoprim/sulfonamide combinations, bacitracins, and tetracyclines through feed (Figure 5; Appendix Figure 13). Flocks from which MDR Campylobacter was isolated (n = 30/218) also had significantly higher median overall AMU. Specifically, these flocks had significantly higher use of injectable lincosamides (Figure 5; Appendix Figure 17); used significantly more aminoglycosides and penicillins through water (Figure 5; Appendix Figure 18); and used significantly more macrolides, penicillins, streptogramins, trimethoprim/sulfonamide combinations, and bacitracins through feed (Figure 5; Appendix Figure 19).
Our study examined AMU trends in broiler chicken production in Canada along with AMR trends in important foodborne bacteria. A reduction in both AMR and AMU was observed across most antimicrobials and classes during 2013–2019. The temporal reduction in AMU reflected the implementation of the Chicken Farmers of Canada’s AMU Reduction Initiative. This AMU stewardship program involved the elimination of the preventive use of certain antimicrobial classes in a stepwise manner (13). Results from this work indicate that a decrease in AMU contributed to a decrease in AMR over time for some antimicrobial drugs; however, increased AMR to streptomycin and tetracycline in Salmonella isolates, an increase in AMR to gentamicin and nalidixic acid in E. coli isolates, and an increase in AMR to nalidixic acid in Campylobacter were observed. We detected an increase in the use of aminoglycosides through water over time, which possibly contributed to the rise in Salmonella and E. coli aminoglycoside resistance. Historically, the administration of antimicrobials through water was largely for treatment of diseases such as those associated with avian pathogenic E. coli (14). Thus, this finding suggests that in addition to the elimination of hatchery-level use, reduced preventive AMU through feed potentially resulted in increased frequency of infectious diseases, thereby increasing the need for AMU through water for disease treatment.
The overall rise the number of classes Salmonella isolates were resistant to in 2019 should also be put in perspective with the serotypes identified on farms. The mean proportion of Salmonella Kentucky relative to total Salmonella isolates increased in 2019 (Appendix Figure 20). Previous work has shown that Salmonella Kentucky frequently carries genes conferring resistance to tetracyclines and aminoglycosides (23). Therefore, the temporal trends in resistance to these antimicrobial classes could reflect the shift in S. enterica serotypes (24). Trends in Salmonella serotypes and AMR prevalence in poultry in Canada were studied recently (25), showing, similar to our results, that different Salmonella serotypes carry different resistance profiles that influence the overall prevalence of resistance. In Canada, passive surveillance in poultry frequently detects Salmonella Kentucky (14). This serotype is 1 of the etiologic agents of enteric disease and high rates of illness in broiler chickens in Egypt (26); however, in Canada, although this serovar was the second-most frequently isolated serovar from passive surveillance, its clinical importance has not yet been determined (14). Further studies should estimate whether reduced prophylactic AMU affects serotype diversity and assess whether the Salmonella Kentucky lineages circulating in poultry in Canada have clinical impact in broilers. In Salmonella-positive flocks, >1 serovar was isolated from a single flock. The serovar isolated from a single sample is generally supposed to represent the most predominant serovar. To reduce potential underestimation of serovar diversity within a flock, CIPARS/FoodNet Canada routinely cultures each sample (4 total).
The study shows that the injection of antimicrobials in ovo or subcutaneously at hatcheries is significantly associated with resistance in foodborne bacteria on the farm. The progressive elimination of AMU administered through injection (ceftiofur in 2014 then gentamicin and lincomycin/spectinomycin at the end of 2018) might have largely contributed to the observed decrease in AMR. In Canada, the injection in ovo or subcutaneously at the hatcheries with ceftiofur was aimed at the prevention of omphalitis caused by E. coli. Since 2005, and after the partial voluntary restriction of its use, a decline in the prevalence of third-generation cephalosporin-resistant Salmonella Heidelberg isolates in retail chicken was observed (8). Moreover, a reduction of AmpC-associated resistance genes was observed in E. coli after the elimination of preventive use in 2014, the second cessation of use nationally (27,28). We found a decrease not only of cephalosporin resistance (ceftriaxone and cefoxitin) but also ampicillin resistance in Salmonella and E. coli during 2013–2019. Therefore, decreased use of ceftiofur may have led to a concomitant decrease in resistance to ampicillin.
We did not identify resistance rate differences between antimicrobial-free and conventional farms. Some studies have shown that antimicrobial-free farms have significantly lower resistance rates for Salmonella (29) and Campylobacter (30) compared with conventional farms, whereas other studies do not report such differences (7,31). In our study, although AMR did not differ according to production system, we observed a significantly higher prevalence of Salmonella Heidelberg on conventional farms (Appendix Figure 1). Similarly, we observed a small to no effect of using the ideal method for cleaning and disinfection (19) on AMR. However, significantly higher prevalence of Salmonella Heidelberg and Kentucky (Appendix Figure 1) were found in flocks that did not use the ideal method of disinfection. This finding raises awareness of the larger impact of AMU even when hygiene methods are ideal, but more important, the shift in serotype composition might have affected AMR rate. For example, Salmonella Kentucky and Heidelberg have the highest frequencies of resistance to ciprofloxacin (32) and to cephalosporins (33). The differences in the number of antimicrobial-free (n = 286) and conventional (n = 1,612) farms included in this study may have affected the ability to detect significant differences in AMR levels between farm categories. As more producers transition to alternate production systems, drivers for AMR other than AMU could be further investigated.
In our study, an overall reduction in resistance levels in indicator and zoonotic foodborne bacteria of broiler chicken origin was successfully achieved in response to changes in AMU practices in broiler chickens in Canada during 2013–2019. Resistance to certain antimicrobial classes have emerged or increased; the increases may be associated with use of aminoglycosides through water for disease treatment, the shift in prevalence of different Salmonella serotypes over time, or both. Farms that use the ideal method of disinfection and farms classified as antimicrobial free had lower prevalence of Salmonella serotypes of higher public health importance, indicating that implementation of sanitation best practices and reduced AMU programs are beneficial. As evidenced by the AMR results, the removal of AMU exposures during the early stages of an animal’s life could further reduce AMR. Additional work should address the effect of reduction of AMU on production costs; relevant production indicators including bird morbidity, mortality, and feed-conversion rates; and bird welfare in broiler chicken farms in Canada. The emerging practices on the use of alternatives to antimicrobials (e.g., vaccines against E. coli, Salmonella, and gut health enhancers) also warrant further investigation. This additional information will provide future guidance for the progressive transition from the current AMU-dependent production systems to alternative and sustainable measures to promote animal health and productivity.
Dr. Huber is an assistant professor in the Department of Pathobiology, Auburn University. She currently researches the impact of antimicrobial use in animal production and on antimicrobial resistance rates. Her main research interests include using a molecular epidemiologic approach to the spread of antimicrobial resistance between animal, humans, and the environment.
Acknowledgments
We acknowledge the poultry veterinarians and producers who voluntarily participated to the farm surveillance program by enabling data and sample collection.
This work was supported by the Swiss National Science Foundation (Eccellenza Grant and National Research Program 72 “Antimicrobial Resistance”) and the Joint Programming Initiative on Antimicrobial Resistance. Grant numbers: PCEFP3_181248 and 40AR40_180179. The Canadian Integrated Program for Antimicrobial Resistance Surveillance program is funded by the Public Health Agency of Canada.
References
- Government of Canada. Yearly food-borne illness for Canada. 2016 [cited 2020 Jul 1]. https://www.canada.ca/en/public-health/services/food-borne-illness-canada/yearly-food-borne-illness-estimates-canada.html
- Bagust T. Food and Agriculture Organization of the United Nations: poultry development review. Poultry health and disease control in developing countries. 2013 [cited 2020 Jul 1]. http://www.fao.org/3/al729e/al729e.pdf
- Page SW, Gautier P. Use of antimicrobial agents in livestock. Rev Sci Tech. 2012;31:145–88. DOIPubMedGoogle Scholar
- Butaye P, Devriese LA, Haesebrouck F. Antimicrobial growth promoters used in animal feed: effects of less well known antibiotics on gram-positive bacteria. Clin Microbiol Rev. 2003;16:175–88. DOIPubMedGoogle Scholar
- Dunne EF, Fey PD, Kludt P, Reporter R, Mostashari F, Shillam P, et al. Emergence of domestically acquired ceftriaxone-resistant Salmonella infections associated with AmpC beta-lactamase. JAMA. 2000;284:3151–6. DOIPubMedGoogle Scholar
- Chang Q, Wang W, Regev-Yochay G, Lipsitch M, Hanage WP. Antibiotics in agriculture and the risk to human health: how worried should we be? Evol Appl. 2015;8:240–7. DOIPubMedGoogle Scholar
- Lestari SI, Han F, Wang F, Ge B. Prevalence and antimicrobial resistance of Salmonella serovars in conventional and organic chickens from Louisiana retail stores. J Food Prot. 2009;72:1165–72. DOIPubMedGoogle Scholar
- Dutil L, Irwin R, Finley R, Ng LK, Avery B, Boerlin P, et al. Ceftiofur resistance in Salmonella enterica serovar Heidelberg from chicken meat and humans, Canada. Emerg Infect Dis. 2010;16:48–54. DOIPubMedGoogle Scholar
- World Health Organization. WHO list of critically important antimicrobials for human medicine. 2018 [cited 2020 Jul 4]. https://apps.who.int/iris/bitstream/handle/10665/325036/WHO-NMH-FOS-FZD-19.1-eng.pdf
- Avery BP, Parmley EJ, Reid-Smith RJ, Daignault D, Finley RL, Irwin RJ. Canadian integrated program for antimicrobial resistance surveillance: Retail food highlights, 2003-2012. Can Commun Dis Rep. 2014;40(Suppl 2):29–35. DOIPubMedGoogle Scholar
- Government of Canada. Canadian Integrated Program for Antimicrobial Resistance Surveillance annual report. 2003 [cited 2020 Jul 4]. https://publications.gc.ca/collections/Collection/H39-1-3-2003E.pdf
- Government of Canada. Categorization of antimicrobial drugs based on importance in human medicine. 2009 [cited 2020 Jul 4]. https://www.canada.ca/en/health-canada/services/drugs-health-products/veterinary-drugs/antimicrobial-resistance/categorization-antimicrobial-drugs-based-importance-human-medicine.html
- Chicken Farmers of Canada. Canadian chicken industry reduces antimicrobial use. 2018 [cited 2020 Jul 8]. https://www.chickenfarmers.ca/wp-content/uploads/2018/10/AMU-Magazine-insides_ENG-Issue2.pdf
- Government of Canada. Canadian Integrated Program for Antimicrobial Resistance Surveillance annual report. 2018 [cited 2020 July 1]. https://www.canada.ca/en/public-health/services/surveillance/canadian-integrated-program-antimicrobial-resistance-surveillance-cipars/cipars-reports/2018-annual-report-executive-summary.html
- Dahoo I, Martin W, Stryhn H. Veterinary epidemiologic research. 2nd edition. Charlottetown (CA, USA): VER Inc.; 2014.
- Agunos A, Gow SP, Léger DF, Deckert AE, Carson CA, Bosman AL, et al. Antimicrobial use indices—the value of reporting antimicrobial use in multiple ways using data from Canadian broiler chicken and turkey farms. Front Vet Sci. 2020;7:
567872 . DOIPubMedGoogle Scholar - Clinical and Laboratory Standards Institute. Performance standards for antimicrobial susceptibility testing (supplement M100). 2019 [cited 2020 Jul 1]. https://clsi.org/media/1930/m100ed28_sample.pdf
- Clinical and Laboratory Standards Institute. Methods for antimicrobial dilution and disk susceptibility testing of infrequent isolated or fastidious bacteria (supplement M45). 2015 [cited 2020 Jul 1]. https://goums.ac.ir/files/deputy_treat/md_labs_ef39a/files/CLSI-M45ed3e-2018(1).pdf
- Meroz M, Samberg Y. Disinfecting poultry production premises. Rev Sci Tech. 1995;14:273–91. DOIPubMedGoogle Scholar
- Government of Canada. List A: list of certain antimicrobial active pharmaceutical ingredients. 2013 [cited 2020 Jul 1]. https://www.canada.ca/en/public-health/services/antibiotic-antimicrobial-resistance/animals/veterinary-antimicrobial-sales-reporting/list-a.html
- Government of Canada. Method of production claims for meat, poultry and fish products. 2019 [cited 2020 Aug 21]. https://www.inspection.gc.ca/food-label-requirements/labelling/industry/method-of-production-claims-on-food-labels/eng/1389379565794/1389380926083?chap=8#s5c8
- World Organisation for Animal Health. OIE annual report on antimicrobial agents intended for use in animals. Better understanding of the global situation. 2020 [cited 2020 Aug 21]. https://www.oie.int/fileadmin/Home/eng/Our_scientific_expertise/docs/pdf/AMR/A_Fourth_Annual_Report_AMR.pdf
- Hawkey J, Le Hello S, Doublet B, Granier SA, Hendriksen RS, Fricke WF, et al. Global phylogenomics of multidrug-resistant Salmonella enterica serotype Kentucky ST198. Microb Genom. 2019;5:
e000269 . DOIPubMedGoogle Scholar - Agunos A, Arsenault RK, Avery BP, Deckert AE, Gow SP, Janecko N, et al. Changes in antimicrobial resistance levels among Escherichia coli, Salmonella, and Campylobacter in Ontario broiler chickens between 2003 and 2015. Can J Vet Res. 2018;82:163–77.PubMedGoogle Scholar
- Caffrey N, Agunos A, Gow S, Liljebjelke K, Mainali C, Checkley SL. Salmonella spp. prevalence and antimicrobial resistance in broiler chicken and turkey flocks in Canada from 2013 to 2018. Zoonoses Public Health. 2021;zph.12769; Epub ahead of print.
- Sorour HK, Gaber AF, Hosny RA. Evaluation of the efficiency of using Salmonella Kentucky and Escherichia coli O119 bacteriophages in the treatment and prevention of salmonellosis and colibacillosis in broiler chickens. Lett Appl Microbiol. 2020;71:345–50.PubMedGoogle Scholar
- Caffrey N, Nekouei O, Gow S, Agunos A, Checkley S. Risk factors associated with the A2C resistance pattern among E. coli isolates from broiler flocks in Canada. Prev Vet Med. 2017;148:115–20. DOIPubMedGoogle Scholar
- Chalmers G, Cormier AC, Nadeau M, Côté G, Reid-Smith RJ, Boerlin P. Determinants of virulence and of resistance to ceftiofur, gentamicin, and spectinomycin in clinical Escherichia coli from broiler chickens in Québec, Canada. Vet Microbiol. 2017;203:149–57. DOIPubMedGoogle Scholar
- Kassem II, Kehinde O, Kumar A, Rajashekara G. Antimicrobial- resistant Campylobacter in organically and conventionally raised layer chickens. Foodborne Pathog Dis. 2017;14:29–34. DOIPubMedGoogle Scholar
- Noormohamed A, Fakhr MK. Prevalence and antimicrobial susceptibility of Campylobacter spp. in Oklahoma conventional and organic retail poultry. Open Microbiol J. 2014;8:130–7. DOIPubMedGoogle Scholar
- Roberts T, McEwen S, Reid-Smith R, Sargeant J, Agunos A, Léger D, et al. Prevalence, risk factors and profiles of resistant Salmonella isolates obtained from Ontario broiler chicken farms at chick placement and pre-harvest [abstract]. In: Proceedings of the 64th Western Poultry Disease Conference; Sacramento, California, USA; 2015 Mar 22–25. p. 101 [cited 2020 Aug 21]. https://aaap.memberclicks.net/assets/WPDC/wpdc_2015.pdf
- European Food Safety Authority. EU summary report on antimicrobial resistance in zoonotic and indicator bacteria from humans, animals and food in 2013. 2015 [cited 2020 Aug 21]. https://www.efsa.europa.eu/en/efsajournal/pub/4036
- Center for Disease Control and Prevention, US Department of Agriculture, USFood and Drug Administration. The National Antimicrobial Resistance Monitoring System (NARMS): the 2012–2013 integrated NARMS report. 2015 [cited 2020 Aug 21]. https://www.fda.gov/media/92766/download
Figures
Tables
Cite This ArticleOriginal Publication Date: August 08, 2021
Table of Contents – Volume 27, Number 9—September 2021
| EID Search Options |
|---|
|
|
|
|
|
|
Please use the form below to submit correspondence to the authors or contact them at the following address:
Laura Huber, Greene Hall, 1130 Wire Rd, Office 271, Auburn University, Auburn, AL 36832, USA
Top