Volume 29, Number 3—March 2023
Research
COVID-19 Test Allocation Strategy to Mitigate SARS-CoV-2 Infections across School Districts
Figure 1

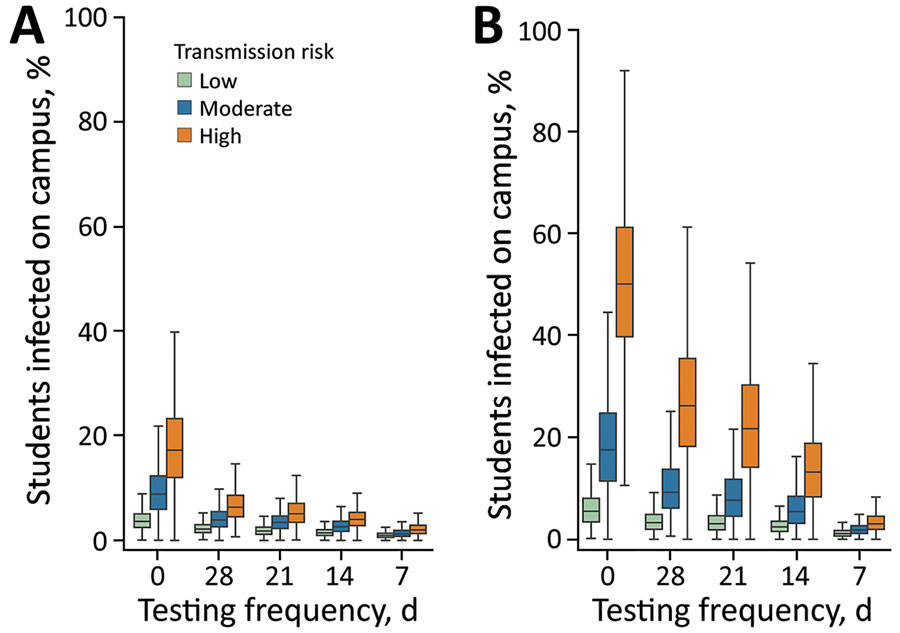
Figure 1. Projected effects of a COVID-19 test allocation strategy to mitigate SARS-CoV-2 infections across 11 school districts in the Austin Independent School District, Austin, Texas, USA. The whisker plots demonstrate projected effects over a 10-week period in a school with 500 students under 2 scenarios: A) assuming the household and classroom of each detected case is quarantined; or B) assuming only households (not entire classrooms) are quarantined. Colors indicate reproduction numbers as low (1.0), moderate (1.5), and high (2.0) in-school transmission risks in the absence of proactive or symptomatic testing, isolation, and quarantine. Whiskers indicate points that lie within 1.5 interquartile ranges of the lower and upper quartiles; boxes indicate interquartile range and horizontal bars indicate median fraction of students infected on-campus depending on the frequency of proactive testing as never (0), or once per every 28, 21, 14, or 7 days. Results are based on 300 stochastic simulations for each scenario.