Skip directly to site content Skip directly to page options Skip directly to A-Z link Skip directly to A-Z link Skip directly to A-Z link
Volume 29, Number 3—March 2023
Research

COVID-19 Test Allocation Strategy to Mitigate SARS-CoV-2 Infections across School Districts

Remy Pasco, Kaitlyn Johnson, Spencer J. Fox, Kelly A. Pierce, Maureen Johnson-León, Michael Lachmann, David P. Morton, and Lauren Ancel MeyersComments to Author 
Author affiliations: The University of Texas at Austin, Austin, Texas, USA (R. Pasco, K. Johnson, S.J. Fox, K.A. Pierce, M. Johnson-León, L.A. Meyers); Santa Fe Institute, Santa Fe, New Mexico, USA (M. Lachmann, L.A. Meyers); Northwestern University, Evanston, Illinois, USA (D.P. Morton)

Main Article

Figure 3

Locations of 11 high schools in the Austin Independent School District, Austin, Texas, USA, used to model a COVID-19 test allocation strategy to mitigate SARS-CoV-2 infections across school districts. A) Daily incidence of COVID-19 infections in late January 2021 in the catchment area of each high school relative to the average incidence across the Austin Metropolitan Statistical Area. Estimates are based on COVID-19 case reports during March 2020–January 2021. A value of one corresponds to the average incidence in the MSA. Schools are listed A through K from highest to lowest estimated daily incidence (Appendix Table 3). B) On-campus transmission risks, estimated from reported COVID-19 cases during August 16, 2020–March 8, 2021. Values are scaled so that 1.0 means that the school reported the expected number of cases, based on a least-squares linear fit of reported cases to school enrollment (Appendix Figure 4).

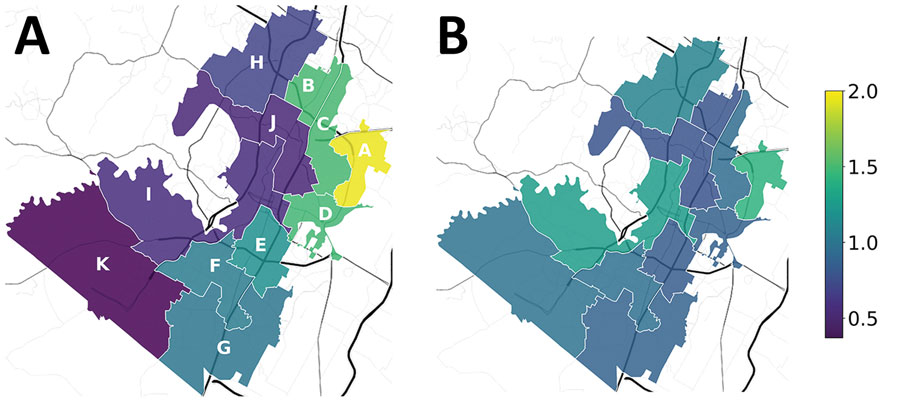
Figure 3. Locations of 11 high schools in the Austin Independent School District, Austin, Texas, USA, used to model a COVID-19 test allocation strategy to mitigate SARS-CoV-2 infections across school districts. A) Daily incidence of COVID-19 infections in late January 2021 in the catchment area of each high school relative to the average incidence across the Austin Metropolitan Statistical Area. Estimates are based on COVID-19 case reports during March 2020–January 2021. A value of one corresponds to the average incidence in the MSA. Schools are listed A through K from highest to lowest estimated daily incidence (Appendix Table 3). B) On-campus transmission risks, estimated from reported COVID-19 cases during August 16, 2020–March 8, 2021. Values are scaled so that 1.0 means that the school reported the expected number of cases, based on a least-squares linear fit of reported cases to school enrollment (Appendix Figure 4).

Main Article

Page created: December 31, 2022
Page updated: February 19, 2023
Page reviewed: February 19, 2023
The conclusions, findings, and opinions expressed by authors contributing to this journal do not necessarily reflect the official position of the U.S. Department of Health and Human Services, the Public Health Service, the Centers for Disease Control and Prevention, or the authors' affiliated institutions. Use of trade names is for identification only and does not imply endorsement by any of the groups named above.
file_external