Volume 29, Number 3—March 2023
Research
COVID-19 Test Allocation Strategy to Mitigate SARS-CoV-2 Infections across School Districts
Figure 4
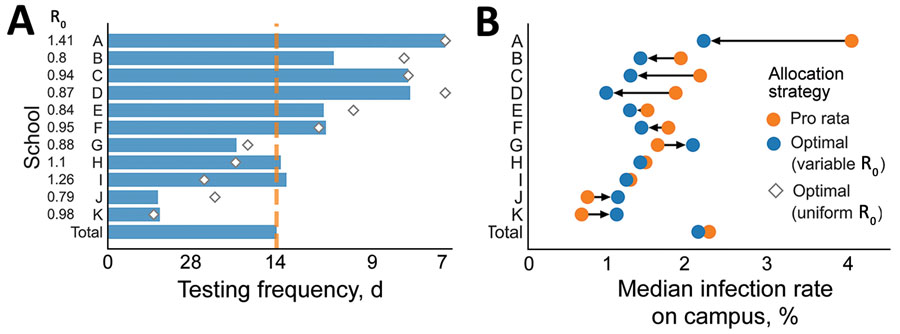
Figure 4. Test allocations and estimated infection rates based on testing frequency in a COVID-19 test allocation strategy to mitigate SARS-CoV-2 infections across 11 school districts in the Austin Independent School District, Austin, Texas, USA. A) Testing allocation for 3 testing strategies. Orange dashed line indicates pro rata strategy; blue bars indicate optimized strategy to minimize the maximum risk; diamonds indicate optimized strategy considering only variation in community transmission risks. Numbers to the left of the y-axis indicate the assumed on-campus reproduction number for each school. B) The median percent of students infected on-campus under the optimized strategy (blue) and pro rata strategy (orange), over a 10-week period; arrows indicate increases or decreases in infection rates. We modeled infections rates by using 3 testing strategies: pro rata, in which all schools test their students once per every 14 days; optimized to minimize the maximum risk of any school, considering variation in both community and in-school transmission risks; optimized considering only variation in community transmission risks. Values are averaged across 300 simulations (Appendix Table 4). The model assumes that classrooms quarantine for 14 days following a positive test.