Volume 29, Number 3—March 2023
Research
COVID-19 Test Allocation Strategy to Mitigate SARS-CoV-2 Infections across School Districts
Figure 5
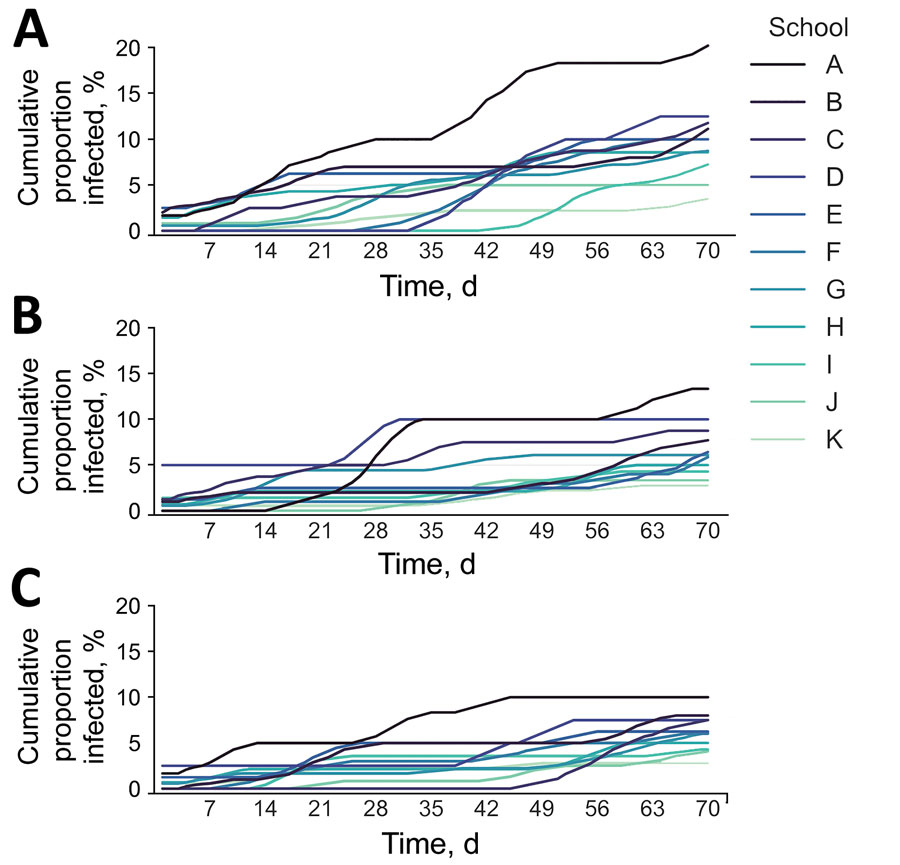
Figure 5. Cumulative infections in schools used to model a COVID-19 test allocation strategy to mitigate SARS-CoV-2 infections across 11 school districts in the Austin Independent School District, Austin, Texas, USA. Graphs represent cumulative COVID-19 infections over a 10-week period under 3 testing scenarios: A) no testing; B) all schools test students every 14 days; and C) optimized allocation of tests based on school-specific transmission risks, assuming a district-wide budget of 1 test per student every 14 days. Schools are ordered from A–K based on community incidence from high to low in the school catchment area. Graphs show 7-day moving averages based on a single simulation for each scenario and school. To show representative projections, we selected the simulation that produced a cumulative attack rate closest to the median across all 300 simulations.