Skip directly to site content Skip directly to page options Skip directly to A-Z link Skip directly to A-Z link Skip directly to A-Z link
Volume 31, Number 1—January 2025
Research

Trichuriasis in Human Patients from Côte d’Ivoire Caused by Novel Species Trichuris incognita with Low Sensitivity to Albendazole/Ivermectin Combination Treatment

Abhinaya Venkatesan1, Rebecca Chen, Max Bär, Pierre H.H. Schneeberger, Brenna Reimer, Eveline Hürlimann, Jean T. Coulibaly, Said M. Ali, Somphou Sayasone, John Soghigian, Jennifer Keiser, and John Stuart GilleardComments to Author 
Author affiliation: University of Calgary, Calgary, Alberta, Canada (A. Venkatesan, R. Chen, B. Reimer, J. Soghigian, J.S. Gilleard); Swiss Tropical and Public Health Institute, Allschwil, Switzerland (M. Bär, P.H.H. Schneeberger, E. Hürlimann, J. Keiser); University of Basel, Basel, Switzerland (M. Bär, P.H.H. Schneeberger, E. Hürlimann, J. Keiser); Université Félix Hophouët-Boigny, Abidjan, Côte d’Ivoire (J.T. Coulibaly); Public Health Laboratory Ivo de Carneri, Chake Chake, Pemba Island, Tanzania (S.M. Ali); Lao Tropical and Public Health Institute, Vientiane, Laos (S. Sayasone)

Main Article

Figure 1

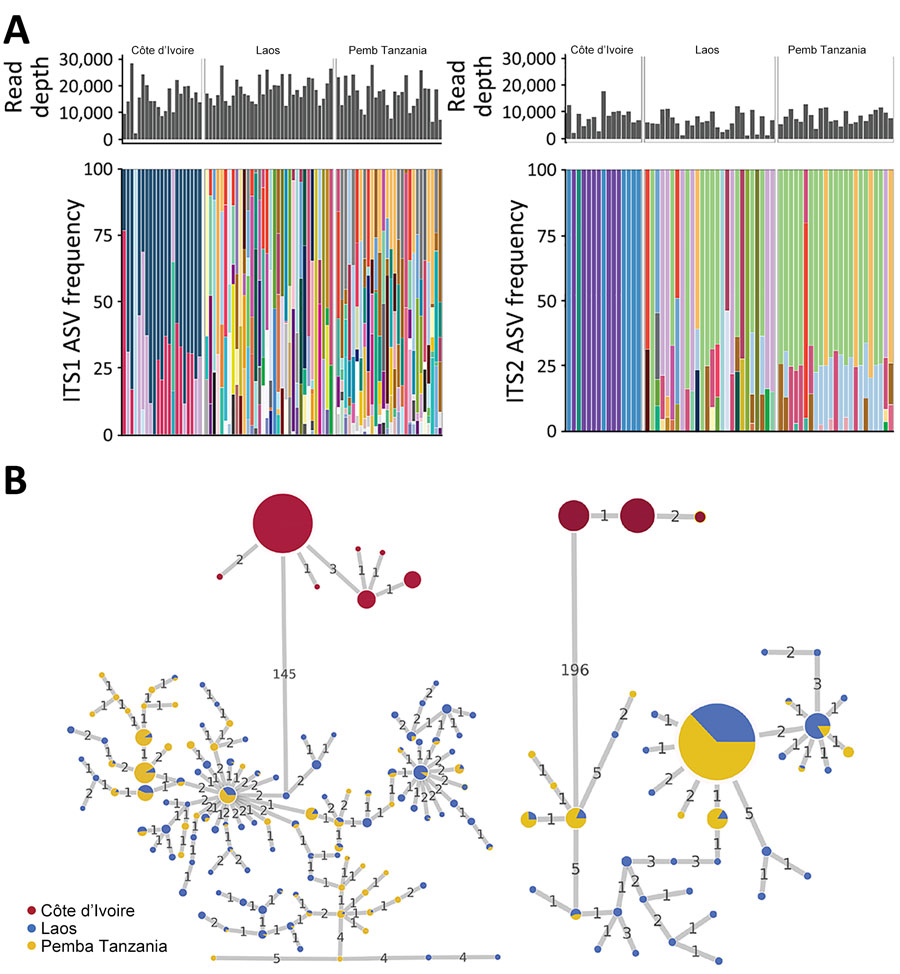
Frequencies and haplotype networks for ASVs of Trichuris spp. ITS1 and ITS2 in study of novel Trichuris incognita identified in patient fecal samples from Côte d’Ivoire and reference sequences. A) Histograms indicate the sequencing read depths and bar plots indicate the relative frequencies of ASVs generated by amplicon sequencing of Trichuris ITS1 (left) and ITS2 (right) loci from samples collected in Côte d’Ivoire, Laos, and Pemba Island, Tanzania. Colored bars indicate similarities or differences in ASV frequencies between the 3 geographic regions. B) Statistical parsimony haplotype networks of ASVs for Trichuris ITS1 and ITS2 loci generated by amplicon sequencing of fecal samples from patients in Côte d’Ivoire, Laos, and Pemba Island, Tanzania. Colored circles indicate the region and size of each circle indicates the ASV frequency. Numbers on connecting lines indicate the number of nucleotide differences between adjacent haplotypes. ASV, amplicon sequencing variant; ITS, internal transcribed spacer.

Figure 1. Frequencies and haplotype networks for ASVs of Trichuris spp. ITS1 and ITS2 in study of novel Trichuris incognita identified in patient fecal samples from Côte d’Ivoire and reference sequences. A) Histograms indicate the sequencing read depths and bar plots indicate the relative frequencies of ASVs generated by amplicon sequencing of Trichuris ITS1 (left) and ITS2 (right) loci from samples collected in Côte d’Ivoire, Laos, and Pemba Island, Tanzania. Colored bars indicate similarities or differences in ASV frequencies between the 3 geographic regions. B) Statistical parsimony haplotype networks of ASVs for Trichuris ITS1 and ITS2 loci generated by amplicon sequencing of fecal samples from patients in Côte d’Ivoire, Laos, and Pemba Island, Tanzania. Colored circles indicate the region and size of each circle indicates the ASV frequency. Numbers on connecting lines indicate the number of nucleotide differences between adjacent haplotypes. ASV, amplicon sequencing variant; ITS, internal transcribed spacer.

Main Article

1Current affiliation: Kwantlen Polytechnic University, Surrey, British Columbia, Canada.

Page created: November 14, 2024
Page updated: December 22, 2024
Page reviewed: December 22, 2024
The conclusions, findings, and opinions expressed by authors contributing to this journal do not necessarily reflect the official position of the U.S. Department of Health and Human Services, the Public Health Service, the Centers for Disease Control and Prevention, or the authors' affiliated institutions. Use of trade names is for identification only and does not imply endorsement by any of the groups named above.
file_external