Skip directly to site content Skip directly to page options Skip directly to A-Z link Skip directly to A-Z link Skip directly to A-Z link

Volume 32, Number 3—March 2026

Dispatch

Extraintestinal Entamoeba moshkovskii Infection, Eastern India

Sanjib Kumar Sardar, Ajanta Ghosal1, Tapas Haldar1, Basudev Ganguly, Koushik Das, and Sandipan GangulyComments to Author 
Author affiliation: The University of Tokyo, Bunkyo, Japan (S.K. Sardar); ICMR–National Institute for Research in Bacterial Infections, Kolkata, India (S.K. Sardar, A. Ghosal, T. Haldar, B. Ganguly, S. Ganguly); Assam University, Guwahati, India (K. Das).

Main Article

Figure 3

Phylogenetic trees constructed from the 18S rRNA and chitinase gene sequences obtained from Entamoeba moshkovskii isolates from a patient in eastern India (red circles) and reference sequences. A) Phylogenetic tree of 18S rRNA. The tree with the highest log-likelihood value (–2,562.32) is shown. Initial heuristic trees were generated automatically using the maximum parsimony approach. The model incorporated a proportion of invariant sites (45.63%). The analysis included 9 nucleotide sequences with 859 aligned positions in the final dataset. B) Phylogenetic tree of chitinase gene sequence. The tree with the highest log-likelihood value (−3,301.96) is presented. Initial heuristic searches were performed automatically using the maximum parsimony method. The final analysis included 20 nucleotide sequences, with a total of 939 positions in the final dataset. GenBank accession numbers are provided. Outgroup taxa are indicated with blue triangles. The phylogeny was inferred using the maximum likelihood method. Scale bars indicate substitutions per site.

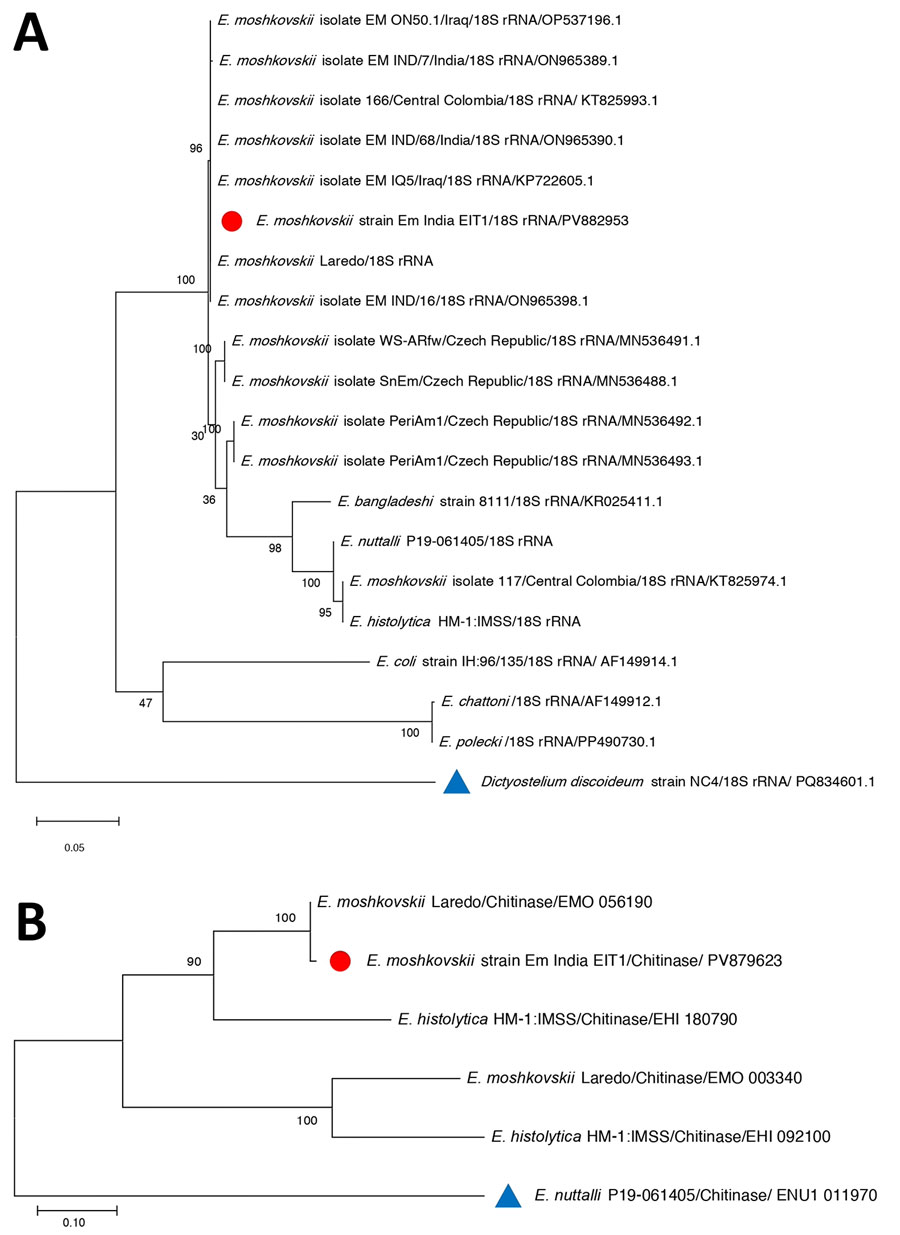
Figure 3. Phylogenetic trees constructed from the 18S rRNA and chitinase gene sequences obtained from Entamoeba moshkovskii isolates from a patient in eastern India (red circles) and reference sequences. A) Phylogenetic tree of 18S rRNA. The tree with the highest log-likelihood value (–2,562.32) is shown. Initial heuristic trees were generated automatically using the maximum parsimony approach. The model incorporated a proportion of invariant sites (45.63%). The analysis included 9 nucleotide sequences with 859 aligned positions in the final dataset. B) Phylogenetic tree of chitinase gene sequence. The tree with the highest log-likelihood value (−3,301.96) is presented. Initial heuristic searches were performed automatically using the maximum parsimony method. The final analysis included 20 nucleotide sequences, with a total of 939 positions in the final dataset. GenBank accession numbers are provided. Outgroup taxa are indicated with blue triangles. The phylogeny was inferred using the maximum likelihood method. Scale bars indicate substitutions per site.

Main Article

1These authors contributed equally to this article.

Page created: February 20, 2026
Page updated: March 20, 2026
Page reviewed: March 20, 2026
The conclusions, findings, and opinions expressed by authors contributing to this journal do not necessarily reflect the official position of the U.S. Department of Health and Human Services, the Public Health Service, the Centers for Disease Control and Prevention, or the authors' affiliated institutions. Use of trade names is for identification only and does not imply endorsement by any of the groups named above.
file_external