Skip directly to site content Skip directly to page options Skip directly to A-Z link Skip directly to A-Z link Skip directly to A-Z link

Disclaimer: Early release articles are not considered as final versions. Any changes will be reflected in the online version in the month the article is officially released.

Volume 32, Number 5—May 2026

Synopsis

Borna Disease Virus 1 as Cause of Fatal Meningoencephalomyelitis in Wild Hedgehogs, Germany, 2022–2025

Effrosyni Michelakaki, Benjamin Schade, Brigitte Boehm, Eva Kappe, Marcel Suchowski, Anne Kupca, Magdalena Schumacher, Anna Maria Gager, Friederike Liesche-Starnecker, Sonja Fiedler, Eva Schwarz, Zoltan Bago, Andreas Blutke, Martin Beer, Dennis Rubbenstroth1Comments to Author , and Kaspar Matiasek1
Author affiliation: Centre for Clinical Veterinary Medicine, Ludwig Maximilians-Universität München, Munich, Germany (E. Michelakaki, S. Fiedler, E. Schwarz, A. Blutke, K. Matiasek); Bavarian Animal Health Service, Poing, Germany (B. Schade, B. Boehm, E. Kappe); Bavarian Health and Food Safety Authority, Oberschleißheim, Germany (M. Suchowski, A. Kupca, M. Schumacher, A.M. Gager); University Medical Center Ulm, Ulm University, Ulm, Germany (F. Liesche-Starnecker); Institute for Veterinary Disease Control, Mödling, Austria (Z. Bago); Institute of Diagnostic Virology, Friedrich-Loeffler-Institut, Greifswald-Insel Riems, Germany (M. Beer, D. Rubbenstroth)

Main Article

Figure 2

Representative changes and composition of immune cells in the central nervous system of Borna disease virus 1–infected hedgehogs in study of the virus as cause of fatal meningoencephalomyelitis in wild hedgehogs, Germany, 2022–2025. A) Multifocal lymphohistiocytic infiltrates with perivascular cuff formation (arrow) and microgliosis (arrowheads) from case 7. Scale bar represents 100 μm. B) Low-magnification section of brainstem from case 7 showing marked hypercellularity, with scattered lymphocytic infiltrates intermingled with astro- and microgliosis. Scale bar represents 250 μm. C, D) Infiltrates also extend into the choroid plexus in case 6 (C) and the subarachnoid space (arrowheads), nerve roots (arrow) and spinal white matter (asterisk) from case 5 (D). Scale bars represent 250 μm. E) CD3 immunohistochemistry of the corresponding brainstem region shown in Figure 1, panel B, confirms the widespread T lymphocyte infiltration, comprising the most invading immune cells. Scale bar represents 250 μm. F) The second most prominent cells involved in antiviral responses are Iba1-positive microglial cells and macrophages (arrows) from case 7. Scale bar represents 200 μm. G) Subarachnoid spaces contain numerous CD3-positive T lymphocytes in case 7. Scale bar represents 50 μm. H) Pax-5 positive B lymphocytes (arrowheads) resemble a minority of immune cells that are here seen concentrated around a blood vessel (arrowheads) from case 1. Scale bar represents 25 μm. I) Scattered Iba1-positive macrophages within subarachnoid spaces from case 7. Scale bar represents 50 μm. Insets in figures G, H, and I show the positive controls for each respective immunohistochemical staining (original magnification ×20). Stains: panels A–D, hematoxylin and eosin; E–I, 3,3′-diaminobenzidine, hematoxylin counterstain, immunohistochemistry using markers; E, CD3; F, Iba1; G, CD3; H, Pax5; I, Iba1.

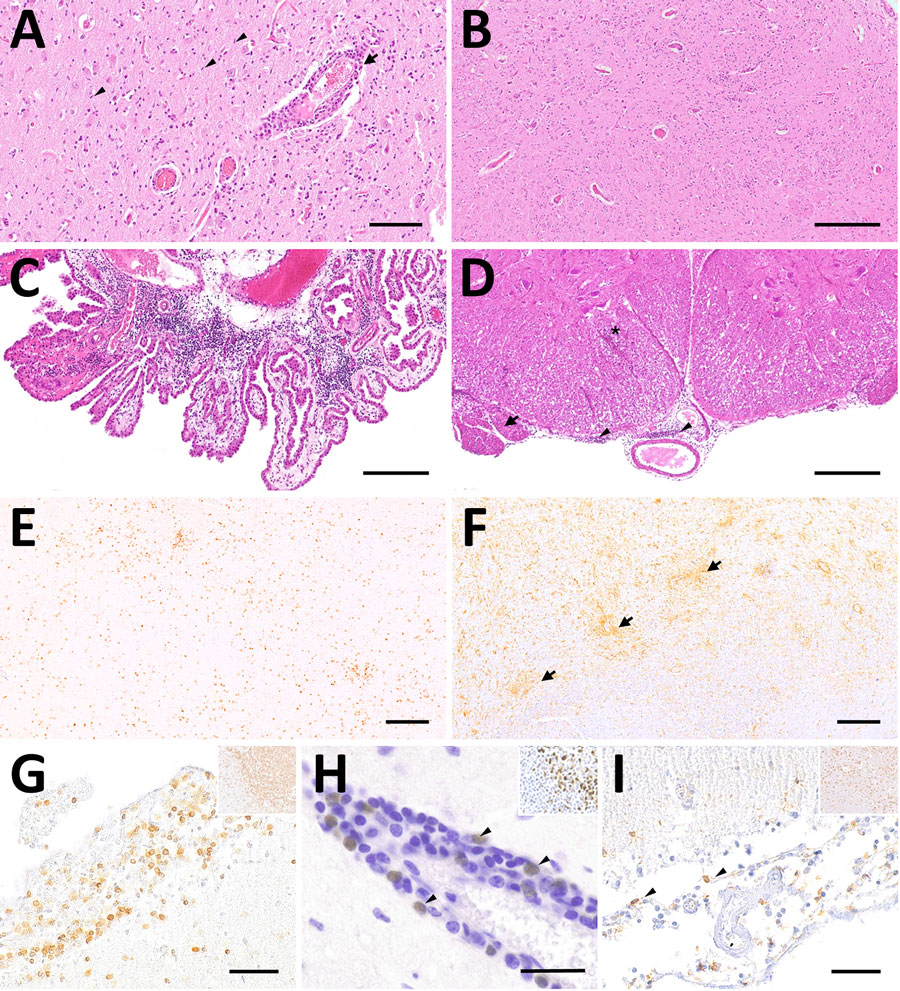
Figure 2. Representative changes and composition of immune cells in the central nervous system of Borna disease virus 1–infected hedgehogs in study of the virus as cause of fatal meningoencephalomyelitis in wild hedgehogs, Germany, 2022–2025. A) Multifocal lymphohistiocytic infiltrates with perivascular cuff formation (arrow) and microgliosis (arrowheads) from case 7. Scale bar represents 100 μm. B) Low-magnification section of brainstem from case 7 showing marked hypercellularity, with scattered lymphocytic infiltrates intermingled with astro- and microgliosis. Scale bar represents 250 μm. C, D) Infiltrates also extend into the choroid plexus in case 6 (C) and the subarachnoid space (arrowheads), nerve roots (arrow) and spinal white matter (asterisk) from case 5 (D). Scale bars represent 250 μm. E) CD3 immunohistochemistry of the corresponding brainstem region shown in Figure 1, panel B, confirms the widespread T lymphocyte infiltration, comprising the most invading immune cells. Scale bar represents 250 μm. F) The second most prominent cells involved in antiviral responses are Iba1-positive microglial cells and macrophages (arrows) from case 7. Scale bar represents 200 μm. G) Subarachnoid spaces contain numerous CD3-positive T lymphocytes in case 7. Scale bar represents 50 μm. H) Pax-5 positive B lymphocytes (arrowheads) resemble a minority of immune cells that are here seen concentrated around a blood vessel (arrowheads) from case 1. Scale bar represents 25 μm. I) Scattered Iba1-positive macrophages within subarachnoid spaces from case 7. Scale bar represents 50 μm. Insets in figures G, H, and I show the positive controls for each respective immunohistochemical staining (original magnification ×20). Stains: panels A–D, hematoxylin and eosin; E–I, 3,3′-diaminobenzidine, hematoxylin counterstain, immunohistochemistry using markers; E, CD3; F, Iba1; G, CD3; H, Pax5; I, Iba1.

Main Article

1These senior authors contributed equally to this article.

Page created: April 02, 2026
Page updated: April 27, 2026
Page reviewed: April 27, 2026
The conclusions, findings, and opinions expressed by authors contributing to this journal do not necessarily reflect the official position of the U.S. Department of Health and Human Services, the Public Health Service, the Centers for Disease Control and Prevention, or the authors' affiliated institutions. Use of trade names is for identification only and does not imply endorsement by any of the groups named above.
file_external