Skip directly to site content Skip directly to page options Skip directly to A-Z link Skip directly to A-Z link Skip directly to A-Z link

Disclaimer: Early release articles are not considered as final versions. Any changes will be reflected in the online version in the month the article is officially released.

Volume 32, Number 8—August 2026

Research

Occupationally Exposed and General Population Antibody Profiles to Influenza A Viruses Circulating in Swine as Indication of Zoonotic Risk

Celeste A. Snyder, Garrett M. Janzen, Giovana Ciacci Zanella, Daniel C.A. Moraes, Gustavo S. Silva, Jefferson J.S. Santos, Elizabeth M. Drapeau, Scott E. Hensley, Tavis K. Anderson, Phillip C. Gauger, and Amy L. BakerComments to Author 
Author affiliation: National Animal Disease Center, US Department of Agriculture Agricultural Research Service, Ames, Iowa, USA (C.A. Snyder, G.M. Janzen, G. Ciacci Zanella, T.K. Anderson, A.L. Baker); Iowa State University College of Veterinary Medicine, Ames (C.A. Snyder, G. Ciacci Zanella, D.C.A. Moraes, G.S. Silva, P.C. Gauger); University of Pennsylvania Perelman School of Medicine, Philadelphia, Pennsylvania, USA (J.J.S. Santos, E.M. Drapeau, S.E. Hensley)

Main Article

Figure 3

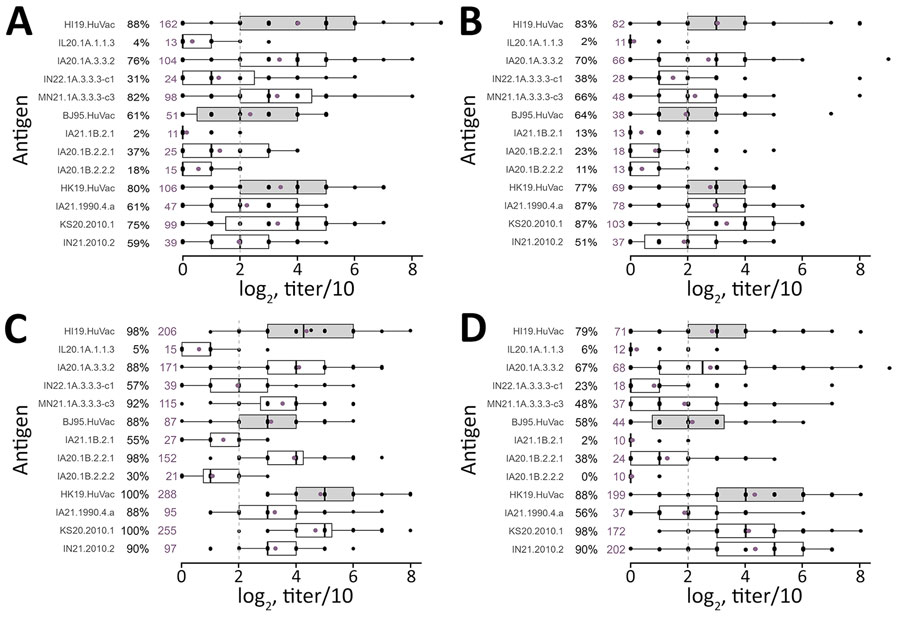
Box and whisker plots of log2 transformed hemagglutination inhibition (HI) titers among participants in 4 human cohorts against contemporary swine H1 and H3 influenza A virus strains in study of occupationally exposed and general population antibody profiles to influenza A viruses circulating in swine as indication of zoonotic risk. A) Veterinarians (n = 51); B) farm employees (n = 47); C) Philadelphia general population cohort (n = 40); D) Hong Kong general population cohort (n = 40). Box plots show median log2 transformed HI titers on the x-axis, test strains on the y-axis, interquartile ranges, and outliers. Purple dots represent the geometric mean log2 transformed HI titers/10. Gray box plots represent responses against human seasonal influenza vaccine strains, and white box plots represent responses against swine strains. Reverse-transformed HI geometric mean titers in purple and percentages of positive persons in black are shown next to virus names on each panel. The gray dotted line indicates the HI titer threshold of 40 (log2 scale of 2).

Figure 3. Box and whisker plots of log2 transformed hemagglutination inhibition (HI) titers among participants in 4 human cohorts against contemporary swine H1 and H3 influenza A virus strains in study of occupationally exposed and general population antibody profiles to influenza A viruses circulating in swine as indication of zoonotic risk. A) Veterinarians (n = 51); B) farm employees (n = 47); C) Philadelphia general population cohort (n = 40); D) Hong Kong general population cohort (n = 40). Box plots show median log2 transformed HI titers on the x-axis, test strains on the y-axis, interquartile ranges, and outliers. Purple dots represent the geometric mean log2 transformed HI titers/10. Gray box plots represent responses against human seasonal influenza vaccine strains, and white box plots represent responses against swine strains. Reverse-transformed HI geometric mean titers in purple and percentages of positive persons in black are shown next to virus names on each panel. The gray dotted line indicates the HI titer threshold of 40 (log2 scale of 2).

Main Article

Page created: June 25, 2026
Page updated: July 15, 2026
Page reviewed: July 15, 2026
The conclusions, findings, and opinions expressed by authors contributing to this journal do not necessarily reflect the official position of the U.S. Department of Health and Human Services, the Public Health Service, the Centers for Disease Control and Prevention, or the authors' affiliated institutions. Use of trade names is for identification only and does not imply endorsement by any of the groups named above.
file_external