Volume 25, Number 1—January 2019
Research
Variable Protease-Sensitive Prionopathy Transmission to Bank Voles
Figure 1
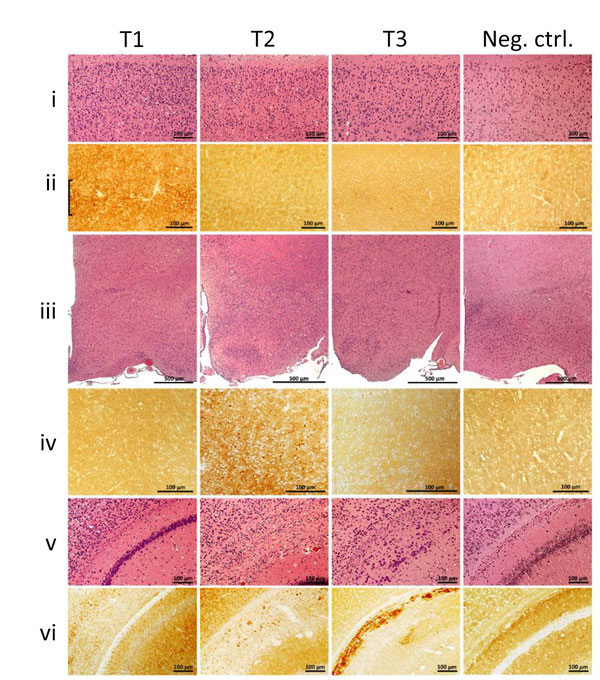
Figure 1. Histopathology and prion protein (PrP) immunohistochemistry images of brain regions from variably protease-sensitive prionopathy (VPSPr)–inoculated bank voles 109I harboring the histopathologic phenotypes T1, T2, or T3. For T1 bank voles, the cerebral neocortex (i, ii) shows moderate spongiform degeneration with substantial PrP immunostaining often displaying a laminar enhancement (bracket), but spongiform degeneration and PrP immunostaining were minimal or lacking in T2 and T3 bank voles (i, ii, T2, T3). By contrast, spongiform degeneration and immunostaining characterized by granular aggregates were selectively prominent in the hypothalamus of T2 but not in T1 and T3 (iii, iv) bank voles. Distinct lesions also occurred in a region comprising dorsal hippocampus and overlying hemispheric white matter (v, vi) where T1 shows hippocampal spongiform degeneration with fine disease-related prion protein (PrPD) deposition; T2 shows granular or small plaque-like PrPD deposition affecting primarily the alveus; and T3 shows an intense and compact PrPD deposition affecting stratum oriens, alveus, and white matter of the corpus callosum. The negative control (Neg Ctrl) column (i–vi) shows tissue from inoculated bank voles that were negative by Western blot. Neither spongiform degeneration nor positive PrP immunostaining was observed in these controls. All panels T1–T3 are from second passage; antibody SAF84. Scale bars for row iii indicate 500 μm; all others indicate 100 μm. This figure is also available online at https://wwwnc.cdc.gov/EID/article/25/1/18-0807-F1.htm.
1These authors contributed equally to this article.