Volume 15, Number 9—September 2009
Research
Susceptibilities of Nonhuman Primates to Chronic Wasting Disease
Figure 1
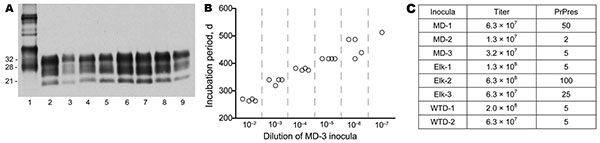
Figure 1. A) Western blot of chronic wasting disease (CWD) inocula showing protease-resistant prion protein (PrPres) in 8 CWD brain homogenate pools used for infecting nonhuman primates. Lane 1, 0.2-mg tissue equivalents of uninfected elk brain not treated with proteinase K; lanes 2–9, samples treated with proteinase K: lanes 2, 6, and 7, 0.12-mg tissue equivalents; lanes 3–5, 8, and 9, 0.67 mg tissue equivalents. PrPres was detected by using antibody L42 against PrP and enhanced chemiluminescence (GE Healthcare, Piscataway, NJ, USA). To provide optimal exposure for viewing PrP in all lanes, blot was exposed to film for 20 min. In this exposure, lanes 2, 6, 7, and 8 were exposed beyond the linear range; this blot could not be used to quantify relative PrPres levels. Values on the left are in kDa. For more accurate quantitations of PrPres, other gels with different amounts loaded were exposed for multiple times (see panel C). B) Titration of MD-3 CWD inoculum. End-point infectivity titrations were calculated for each CWD inoculum by inoculating 50 μL of serial 10-fold dilutions of each brain homogenate into transgenic mice expressing deer PrP, starting with a 1% (10–2) brain homogenate. Shown are data for an MD-3 inoculum. As the inoculum became more dilute, the incubation period (in days) and variability within a group increased. Each open circle represents 1 mouse in which clinical CWD developed. One mouse inoculated with a 10–6 dilution and 5 mice inoculated with a 10–7 dilution did not become sick after 625 days (solid circles). C) Infectivity titer and PrPres levels of each CWD pool. Titers are 50% infectious dose/g of brain homogenate. Relative level (%) of PrPres in each pool was measured by Western blot with a combination of serial dilutions and sequential exposure times in the linear response range for each sample. Data obtained from these comparisons are summarized in the PrPres column. All pools were compared with the pool with the highest PrPres signal (Elk-2), which was set at 100%.