Volume 21, Number 1—January 2015
Research
Protocol for Metagenomic Virus Detection in Clinical Specimens1
Figure 5
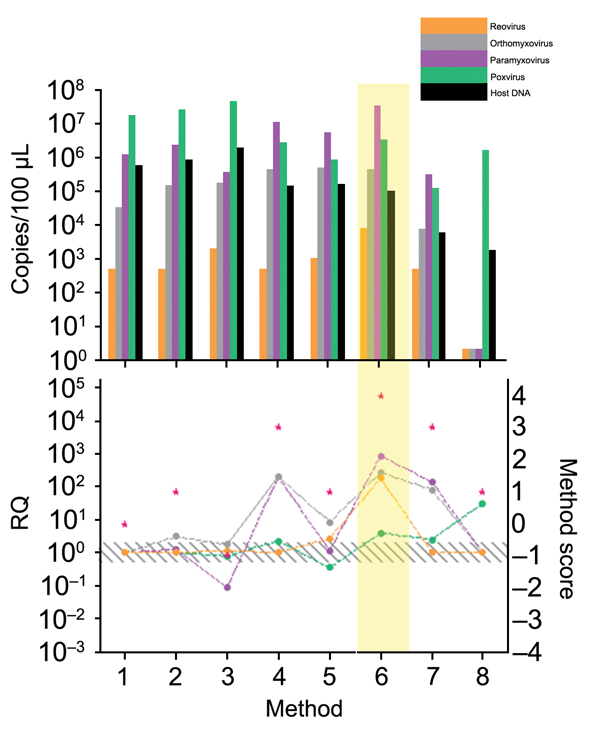
Figure 5. Comparison of enrichment methods used for development of tissue-based universal virus detection for viral metagenomics protocol. Copy numbers were measured by quantitative PCR in duplicate. RQ, relative quantification: RQ (2 – ΔΔCt); (ΔΔCt = Δ purified – Δ unprocessed). Lower panel left y-axis indicates signal-to-noise ratio (RQ) for all viruses tested. The method with the highest score was used to establish the protocol and is shaded in yellow. Red stars indicate highest scores. Diagonally striped area indicates not significant. Ct, cycle threshold. Numbers along baseline indicate method used. 1, control; 2, PEG-It (System Biosciences, Mountain View, CA, USA); 3, InRichment Virus Reagent Kit (Analytik Jena AC, Jena, Germany); 4, clearing centrifugation; 5, clearing centrifugation at 25,000 rpm for 2 h; 6, second clearing centrifugation after 20% sucrose centrifugation; 7, tissue enrichment; 8, Ribominus Eukaryote Kit (Life Technologies, Grand Island, NY, USA).
1Preliminary results of this study were presented at the Biodefense and Emerging Infectious Diseases Meeting, January 29, 2014, Washington DC, USA.