Volume 27, Number 3—March 2021
Research
Foodborne Origin and Local and Global Spread of Staphylococcus saprophyticus Causing Human Urinary Tract Infections
Cite This Article
Citation for Media
Abstract
Staphylococcus saprophyticus is a primary cause of community-acquired urinary tract infections (UTIs) in young women. S. saprophyticus colonizes humans and animals but basic features of its molecular epidemiology are undetermined. We conducted a phylogenomic analysis of 321 S. saprophyticus isolates collected from human UTIs worldwide during 1997–2017 and 232 isolates from human UTIs and the pig-processing chain in a confined region during 2016–2017. We found epidemiologic and genomic evidence that the meat-production chain is a major source of S. saprophyticus causing human UTIs; human microbiota is another possible origin. Pathogenic S. saprophyticus belonged to 2 lineages with distinctive genetic features that are globally and locally disseminated. Pangenome-wide approaches identified a strong association between pathogenicity and antimicrobial resistance, phages, platelet binding proteins, and an increased recombination rate. Our study provides insight into the origin, transmission, and population structure of pathogenic S. saprophyticus and identifies putative new virulence factors.
Staphylococcus saprophyticus is the cause of uncomplicated urinary tract infection (UTI) in 10%–20% of young women (1). Despite a greater successful treatment rate, S. saprophyticus UTI has a higher recurrent infection frequency than Escherichia coli UTI (2). Rare complications of S. saprophyticus UTI include acute pyelonephritis, nephrolithiasis, and endocarditis (3).
S. saprophyticus frequently colonizes humans and can be found in the gastrointestinal tract, vagina, and perineum (4). S. saprophyticus also is part of the gut and rectal flora of livestock, including pigs and cattle, and a frequent contaminant of meat and fermented food products (1). S. saprophyticus also has been recovered from polluted aquatic environments (5).
The reservoirs of S. saprophyticus causing UTI in humans are believed to be endogenous, but evidence is lacking. Moreover, given the frequent bacterial contamination of meat through the meat-processing chain, meat and food are speculated to be sources of human gut colonization and human S. saprophyticus infection (6). Some studies have reported high genetic diversity among isolates from human infections, food products, and other sources (5,7,8). However, previous studies were performed with a limited number of isolates, which prevented the description of the global and local molecular epidemiology of S. saprophyticus.
We used phenotypic, genomic, and pangenome-wide association study (pan-GWAS) approaches to characterize S. saprophyticus both globally and locally. In addition, we identified adaptive features that drive S. saprophyticus evolution, defined the S. saprophyticus population structure, investigated dissemination routes, and identified new pathogenicity factors.
Ethics Considerations
The human isolates used in our study were recovered as part of routine clinical diagnostic testing; thus, ethics approval and informed consent were not required. All data were handled anonymously. Sample collection was in accordance with the European Parliament and Council decision for the epidemiologic surveillance and control of communicable disease through the European Antimicrobial Resistance Surveillance Network (https://www.ecdc.europa.eu/en/activities/surveillance/EARS-Net/Pages/index.aspx). Slaughterhouse samples were part of the routine control practices for evaluation of good hygiene practices and programs to assure meat safety (European Parliament and Council regulation no. 853/2004).
Bacterial Isolates
The global S. saprophyticus collection we used included 299 isolates from humans collected in 7 countries during 1997–2017: 286 from UTIs, 12 from invasive disease, and 1 from colonization (Appendix 1 Table 1). We also analyzed the genomes of S. saprophyticus for 38 isolates from 5 other countries: 35 isolates from human UTIs (8), 2 from human hand swabs (8), an isolate from Byzantine Troy (8), and ATCC 15305 (9), a previously investigated human UTI-causing isolate.
The local collection included isolates collected in Lisbon, Portugal, during 2016–2017: 128 human UTI isolates collected in 3 hospitals and 104 slaughterhouse isolates collected from equipment, pork samples, workers’ hands, and a pig’s rectum. In addition, we included 5 isolates from animals and 12 isolates from food used in other studies (8) (Appendix 2).
Whole-Genome Sequencing and Assembly
Phylogenetic Analysis
Figure 1
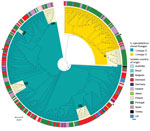
Figure 1. Maximum-likelihood tree of Staphylococcus saprophyticusisolates recovered from human infections and colonization globally, 1997–2017. The tree was constructed by using 9,134 SNPs without recombination. Among analyzed isolates, 321 were...
Figure 4
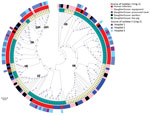
Figure 4. Growth rate of Staphylococcus saprophyticusclonal lineages in tryptic soy broth (TSB) and in different concentrations of female sex hormones. All assays were performed in triplicate and each experiment...
We performed whole-genome sequencing (WGS) on MiSeq (Illumina, https://www.illumina.com) and MinIon nanopore (Oxford Nanopore, https://nanoporetech.com) platforms, as described (10) (Appendix 2). We separately analyzed global population and local epidemiology of S. saprophyticus and their phylogeny by using single-nucleotide polymorphisms (SNPs). We identified SNPs by mapping the draft genomes to a reference genome, S. saprophyticus ATCC 15305 (GenBank accession no. AP008934.1) by using the web-based CSI phylogeny version 1.4 (11) with the default parameter, but we disabled the minimum distance between SNPs in the parameter. We used Gubbins version 2.3.4 (12) with default parameters to concatenate SNPs and remove recombination regions. We reconstructed the phylogenies by using RAxML version 8.2.4 (https://github.com/stamatak/standard-RAxML) and generalized time-reversible nucleotide substitution with gamma correction model with 100 bootstrap value. We visualized the maximum-likelihood trees by using Interactive Tree of Life (ihttps://itol.embl.de) (Figures 1–3; Appendix 2 Figure 3). Recombination to mutation (r/m) ratios detected by using Gubbins were calculated as the average r/m of isolates in the entire collection and separately for each lineage by using as reference closed genomes of KS40 for lineage G and KS160 for lineage S, both obtained on the MinIon platform (Oxford Nanopore).
Pan-GWAS
We used Prokka version 1.13 (https://vicbioinformatics.com/software.prokka.shtml) to annotate genomes and defined the pangenome by using 85% blastp (https://blast.ncbi.nlm.nih.gov/Blast.cgi) identity in Roary version 3.12 (http://sanger-pathogens.github.io/Roary). We performed GWAS by using Scoary version 1.6.16 (13) to identify genes associated with lineages and considered Bonferroni corrected p<0.05 (odds ratio [OR] >1) statistically significant; we identified genes associated with epidemiologic groups and considered Benjamini Hochberg corrected and pairwise comparison p<0.05 statistically significant. Sequence data from this study are available in GenBank (accession no. PRJNA604222).
Resistome and Virulome Analyses
We screened genomes for resistance and virulence genes by using ResFinder version 2.3 (https://cge.cbs.dtu.dk/services/ResFinder), an in-house virulence genes database, and the virulence factor database (14), integrated into ABRicate version 0.5 (https://github.com/tseemann/abricate). We considered genes with a threshold >90% nucleotide identity and >60% coverage to be present.
Statistical Analyses
We used Prism 6.0 (GraphPad, https://www.graphpad.com) to compare the means of 2 groups. We used a 2-tailed unpaired Mann-Whitney test or χ2 test for comparison and considered p<0.05 statistically significant.
Lineages of S. saprophyticus Causing UTIs
Among study isolates, we first analyzed the diversity of S. saprophyticus causing UTIs by using genomic data of 321 human UTI isolates collected from 8 countries on 4 continents during 1997–2017. From the SNPs initially detected, 42% arose from recombination events in the population, corresponding to a mean genome-wide r/m of 1.5:1, meaning that high accumulation of SNPs was due to recombination rather than mutation in UTI strains. The maximum-likelihood tree constructed from the 9,134 SNPs without recombination defined 2 lineages, which we called G and S (Figure 1). Most (74%, 236/321) UTI isolates were from lineage G and differed by 0–4,318 SNPs with an average nucleotide identity (ANI) of 98.5%–99.999%, whereas S isolates (26%, n = 85/321) were slightly less distantly related, differing by 0–3,540 SNPs with an ANI of 99.3%–99.991% (Appendix 2 Figure 1).
Figure 2
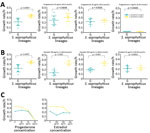
Figure 2. Phylogenomic analysis and distribution of Staphylococcus saprophyticusisolates collected from human infections and a slaughterhouse, Portugal, 2016–2017. A) Maximum-likelihood tree of 232 isolates from human infections or slaughterhouse contamination....
S. saprophyticus lineages we identified among UTI isolates worldwide had distinctive features indicative of 2 evolutionary histories. Although strains of both lineages had similar genome size as determined by their closed genomes (lineage G was 2.5 Mb and S 2.6 Mb), isolates from lineage S (n = 6) grew significantly faster in tryptic soy broth incubated at 37°C (μaverage = 0.34 h–1) than G strains (n = 8) (μaverage = 0.22 h–1; p = 0.0007) (Figure 4; Appendix 2). Moreover, we separately analyzed r/m of both lineages by using the respective closed genome of strains from each lineage as a reference and found that the mean estimated r/m was 9 times higher in S isolates (r/m = 4.4:1) than G isolates (r/m = 0.5:1). We did not detect a temporal signal when performing regression analysis (r) of tip-to-root distance versus isolation date, either in the entire collection (r = −0.2423) or for separate lineages (for G, r = −0.1314; for S, r = 0.1889) (Appendix). Hence, we could not determine when the 2 lineages diverged. The lack of temporal signal probably results from the limited number of isolates in each time point.
Figure 3
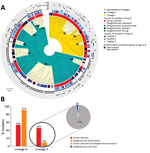
Figure 3. Maximum-likelihood tree depicting the genetic relatedness of Staphylococcus saprophyticusisolates belonging to clonal lineage G recovered from human infections or slaughterhouse contamination, Portugal, 2016–2017. Each node represents a strain....
Figure 5
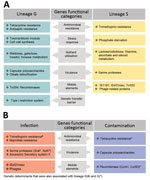
Figure 5. Genetic determinants that contribute to the distinction of clonal lineages and lifestyle of Staphylococcus saprophyticus. The graph displays determinants that contribute (A) and mediate (B) adaptation of ...
To further compare the 2 lineages, we constructed the pangenome of the 338 human S. saprophyticus genomes and identified 10,222 genes with 85% blastp clustering by using Roary. Among these, 8,351 genes, present in <99% of the genomes, constituted the accessory genome. A gene accumulation plot of all the genes against the genomes sequenced showed that S. saprophyticus has an open pangenome (Appendix 2 Figure 2, panels A, B). The pan-GWAS analysis of the accessory genome indicated that G and S isolates have different genomic content (Bonferroni p<0.05, OR >1). A total of 128 genes were specific/enriched in the G lineage, including those encoding a type I restriction subunit (group_383), a defense mechanism against genetic transfer (15); metabolism of melibiose (ebgA, melB) (16) and inositol (iolE) (17), compounds that are excreted in urine; toxin–antitoxin systems (group_4685, group_5665), involved in stress response (18); and antimicrobial resistance (qacA) (19) (Table 1; Figure 5, panel A; Appendix 2 Table 1).
For S lineage, 237 genes were specific/enriched, some of which are involved in metabolism of ascorbate (ulaA) and thiamine (tenI) (20); induction of phosphate starvation (psiE), which was previously linked to switch on virulence in other uropathogens (21); platelet binding (splE, sdrE) associated with virulence (22); steroid metabolism (group_7190); and resistance to trimethoprim (dfrG) and biocides (qacC) (Table 2; Figure 5, panel A; Appendix 2 Table 1). Additional genes associated with S lineage that could explain its increased growth rate include those linked to lactose and cellobiose metabolism (group_5572 gene) (23) and cell wall hydrolysis (lytN) (24), whereas the prevalence of transposases (group_3547 and group_1828) (25) and phage genes (recT and yueB) (27) could justify its increased recombination rate.
Local and Global Spread of S. saprophyticus Clones Causing UTIs
We observed no time-based clustering of S. saprophyticus UTI isolates in the phylogeny, but we noted some geographic clustering. In particular, 89% (n = 78) of S isolates were found in Portugal and Spain (Figure 1). In addition, we identified clusters containing isolates from a single country. For instance, cluster G3 (1–8 SNPs) contained only isolates from Portugal and cluster G1 (0–63 SNPs) only isolates from Denmark (Figure 1).
We noted a high degree of isolate admixture in the maximum-likelihood tree of our global collection, suggesting that S. saprophyticus isolates of both lineages are disseminated geographically. G strains were distributed most widely, in 11 countries on 4 continents, whereas we found S isolates in only 6 countries. Despite the genetic diversity described, we still found isolates from different countries that differed by only a few SNPs. One pair in cluster G4 that had only 10 SNPs difference was a blood isolate from Barcelona, Spain (KS266), and a UTI isolate from Lisbon (KS135), collected in 2016 (Figure 1).
Although a relatedness cutoff is not defined yet for S. saprophyticus, the low number of SNPs observed between strains from the same and different countries is below the relatedness cutoff of 10–40 SNPs for most bacterial species (28). The apparent relatedness we noted implies that UTI isolates from different patients in the same country and in different countries are highly related and could belong to a cross-border chain of transmission. This finding challenges the assumption that S. saprophyticus causing UTIs were mainly endogenous (29).
Genetic Relatedness of S. saprophyticus from Slaughterhouses and UTIs
Pork is the most frequently consumed red meat in Europe (30) and is often contaminated with S. saprophyticus (1). We found that 35% of slaughterhouse samples (from meat, equipment, workers’ hands, and a live pig) were contaminated with S. saprophyticus.
To understand whether S. saprophyticus causing UTIs could be related to S. saprophyticus in pork, we compared 104 isolates collected from a slaughterhouse against 128 isolates collected from human UTIs in Lisbon during 2016–2017. Among the 104 isolates from the slaughterhouse, 39 (37.5%) were collected from meat, 32 (30.8%) from equipment, 32 (30.8%) from workers’ hands, and 1 (≈1%) from a live pig. SNP-based phylogenetic analysis with a tree-rooted at the midpoint showed that most (91%; 95/104) slaughterhouse isolates belonged to lineage G (Figure 2, panels A, B) and that a strain from slaughterhouse equipment was at the base of this lineage (bootstrap 100). In addition, the phylogenetic reconstruction including isolates from this study and other isolates from production and companion animals (including 2 pigs, 2 bovine, and 1 canine) and food (8) showed that most (3/5) animal isolates clustered together at a basal clade of lineage G (bootstrap 100) (Appendix 2 Figure 2). Some clusters in the phylogenetic tree (e.g., G9) had slaughterhouse isolates at the base and UTI isolates at the tip. However, we also observed the opposite (e.g., G11), tree clusters with slaughterhouse isolates at the tip and UTI isolates at the base (Figure 2, panel A). Moreover, 41% of G strains included the antimicrobial resistance gene tetK (p<0.0001) (Figure 2, panel A), which is associated with resistance to tetracycline, an antimicrobial drug extensively used in animal production (31).
Phylogenetic reconstruction of all isolates from Lisbon based on SNPs provided additional examples of admixture of isolates recovered from different sampling sites in the slaughterhouse and from the slaughterhouse and humans. Isolates from meat were frequently intermixed with isolates from equipment and colonized workers as observed in cluster G6, wherein stains differed by only 1–65 SNPs (Figure 2, panel A; Figure 3). Likewise, cluster G9 included isolates from the slaughterhouse that were intermixed with human UTI isolates. Isolates collected from slaughterhouse equipment differed by only 19 SNPs from human UTI isolates. Likewise, human UTI isolates differed from meat isolates by 25 SNPs and from isolates of colonized workers by 26 SNPs. In addition, slaughterhouse and human UTI isolates had the same antimicrobial resistance profile, exhibiting resistance to fosfomycin, fusidic acid, and tetracycline (Appendix 1 Table 1). We could not ascertain any epidemiologic link between the workers in the slaughterhouse and UTI patients, due to data protection limitations, but contact with meat production previously has been identified as a risk factor for UTI (6).
The only live-pig isolate was intermixed in cluster G8 with isolates from meat, slaughterhouse workers, and UTI patients (Figure 3), having 307–658 SNPs difference. The admixture of strains in the tree suggests the existence of frequent cross-transmission within the slaughterhouse and between the slaughterhouse and humans.
Insufficient disinfection procedures probably contributed to the high transmission rate of S. saprophyticus within the slaughterhouse, as demonstrated by the highly related strains (<11 SNPs) on dirty and clean equipment surfaces and similar strains (<16 SNPs) isolated 12 months apart. Carriage of the antimicrobial resistance gene, qacA, by all G strains could justify the observed unsuccessful cleaning procedures (Figure 2, panel A).
The accumulation of substitutions and genetic distance evidenced by the phylogenetic analysis suggest that isolates from slaughterhouses and food probably are the primary sources of S. saprophyticus G strains (Figure 3). Transmission probably occurs more frequently from the slaughterhouse and food to humans; however, we cannot ascertain directionality due to the lack of temporal signal.
Evidence Supporting the Human Origin of Lineage S
In contrast to isolates belonging to lineage G, which were mostly from UTIs and the slaughterhouse, S isolates were almost exclusively of human origin (97%; n = 66/68), either from UTIs (n = 59) or human colonization (n = 7) (Figure 2, panels A, B). When we reconstructed the phylogeny of all isolates in this and other studies (8) (Appendix 2 Figure 3), a human isolate was at the base of the S lineage. The only 2 S isolates seen in animals were from nonhuman primates. Furthermore, a resistance determinant for trimethoprim (dfrG), which routinely is used to treat human UTIs, was associated with this lineage (18%; p<0.05) (Figure 2, panel A; Table 2).
To determine whether S isolates could have originated in humans, we grew isolates from both lineages in the absence and presence of human physiologic concentrations (15–350 pg/mL) of estradiol (32), a female hormone commonly found in urine and the vagina, and in different pH values mimicking the stomach (pH 2.5), vagina (pH <4.5) (33), skin (pH 5.5), and urine (pH 4.5–8.0) (34). The growth rate of S isolates did not change significantly at the highest physiologic concentration of estradiol specific to humans (0.34 h–1 vs. 0.33 h–1), but the growth rate for G strains decreased by 59% at this concentration (0.22 h–1 vs. 0.13 h–1; p = 0.0007) (Figure 4, panels A–C; Appendix 2). All isolates grew at all pH levels assayed, except for pH 2.5. At pH 4.5 and 5.5, isolates of both lineages had similar growth rates, but S isolates had a higher growth rate than G isolates at pH 8, although this difference was not statistically significant (p = 0.133). These results suggest that lineage S isolates are more adapted than lineage G strains to high estradiol concentrations found in women, but not found in other female animal hosts, such as pigs, bovine, or canines (35). GWAS also identified a gene involved in steroid metabolism, 3-β hydroxysteroid dehydrogenase (HSD), associated with lineage S (Table 2; Figure 5, panels A, B). Steroids such as estradiol are primary signaling molecules for host–microbe interactions (26) and involved in the interconversion of active and inactive steroid hormones (26). Presence of HSD could be an adaptive evolution to colonization of the bladder, a hormone-rich environment. Evidence supports a human (primate) origin for lineage S, but studies sampling a wider range of ecologic sites and geographic regions are needed.
UTIs and S. saprophyticus Dissemination among Humans in the Community
To explore dissemination of S. saprophyticus causing UTIs in the community through human-to-human contact, we analyzed genomic data of the 128 UTI isolates from outpatients of 3 hospitals in the Lisbon area. Transmission of S. saprophyticus from lineage G and S between persons in the community was apparent, as demonstrated by the high relatedness of strains from UTI patients at different hospitals. In the G cluster, G10 isolates had 9–24 SNPs difference, and in the S cluster, S2 isolates differed by 6–64 SNPs (Figure 2, panel A). However, due to data protection regulations, we could not ascertain whether the patients were epidemiologically linked. Results suggest that patients might have acquired these strains from the same reservoir or that direct and indirect cross-transmission could have occurred in the community.
Disease Signatures among S. saprophyticus Populations
Several virulence factors, including urease, have been described in S. saprophyticus (36), but the basis of pathogenicity in this species is mainly unknown. We used a pan-GWAS approach to compare the genetic content of 128 isolates from human infections to 104 isolates recovered from a slaughterhouse, all collected in Lisbon during 2016–2017. We identified 6 genes that appear to be associated with an increased pathogenic potential in S. saprophyticus (Figure 5, panel A; Appendix 2 Tables 2–5). These genes included those encoding an SplE-like protein and a gene cluster encoding a complete accessory secretory system associated with a serine-rich adhesion, similar to SraP. Previous studies have described highly homologous secretory system (>97% nucleotide identity) associated to serine-rich proteins that bind platelets, including SraP in S. aureus (37) and UafB in S. saprophyticus (38).
We also found other genes associated with infection that encoded phage proteins. An analysis on 128 UTI isolates using PHASTER (39) identified 5 phages in 48 (38%) strains. The phages were 38–125 Kb and had <50% identity with any known phage. The genomic vicinity of the identified phages varied in the chromosome, suggesting that lysogenic conversion was not the mechanism involved in pathogenicity of these strains; instead, hypothetical phage genes could be crucial for pathogenicity. In addition, genes encoding resistance to the antimicrobial drugs trimethoprim (dfrG), lincosamide (lnuA), streptogramin B (erm44v), or to macrolides (mphC-msrA) also were associated with strains from human infections (Figure 2; Figure 5, panel B; Appendix 2 Tables 2–5).
Another factor highly associated with human infections was the occurrence of recombination, which was 6 times higher in isolates from UTIs (r/m 1.7:1) than from isolates associated with colonization or contamination (r/m 0.3:1). This finding suggests recombination might be a strategy of S. saprophyticus to evade the host immune system, as described elsewhere (40).
We identified 2 S. saprophyticus lineages, G and S, associated with human UTIs that appeared to have different evolutionary histories. Our data support a foodborne origin for lineage G and its transmission through food products to humans. We also found evidence of a human origin for lineage S and additional proof for the occurrence of direct or indirect human-to-human dissemination in the community, which could explain not only the local dissemination of both lineages but also the wide geographic dissemination, as described for S. aureus (41) and E. coli (42).
Our conclusions were limited by the characteristics of the sample collection analyzed. In particular, the lack of temporal signal did not enable inference of the direction of transmission between the sampling sites. We could establish obvious genomic relatedness between the meat production chain and human UTIs and UTIs from different persons in the community. However, lack of samples from other animal hosts, environments, or different ecologic niches in humans, did not enable us to establish pig meat and humans as the unique sources of the 2 lineages nor identify the preferred ecologic niche of S. saprophyticus in humans.
Figure 6

Figure 6. A proposed model for the dissemination and transmission of Staphylococcus saprophyticus in the community. The arrows represent the dissemination and transmission of S. saprophyticusisolates that belonged...
Our observed S. saprophyticus colonization rate among pigs was extremely low (1%) compared with previous studies (43), which could be explained by possible cross-inhibitory bacterial interactions (44); however, contamination within the slaughterhouse environment sometimes reached 35%. Amplification of S. saprophyticus in the slaughterhouse environment was probably potentiated by resistance to biocides. We found that slaughterhouse workers’ washed hands were colonized with strains that were highly related to slaughterhouse environmental isolates and to strains causing UTIs, suggesting exposure of workers to the slaughterhouse environment as a risk factor for human colonization (Figure 6).
The transmission chain of S lineage isolates appears to be different and to have no link to meat production. S lineage UTIs might originate from human gut or vaginal colonization; both have been reported as possible human niches (2,4). Evidence for the human origin of S lineage included the almost exclusive (97%) identification in humans, where S lineage was better adapted to the physiologic high concentration of human female sex hormones; grew at vagina, skin, and urine pH values; and harbored 2 serine-proteases that presumably can bind to human platelets, as described for SraP (37). The distinct genetic content and phenotypic features of lineages G and S further reflected the diverse selective pressures of the human and animal, slaughterhouse, and food environments and suggest different evolutionary strategies toward pathogenicity. In particular, we found that tetracycline and antimicrobial resistance genes associated with colonization-contamination also were associated with isolates of the G lineage. Furthermore, genes encoding sugar metabolism, serine proteases, and a trimethoprim resistance associated with infection were also associated with isolates of the S lineage, implying distinctive specialization of the 2 lineages.
Our results also indicate a key role of setting-associated antimicrobial drug usage, especially for trimethoprim, macrolides, and tetracycline, in resistance development and pathogenicity. Subinhibitory concentrations of these drugs have been shown to promote virulence in bacteria through the induction of biofilm production (45), quorum-sensing (45), or phages (46) and might also increase S. saprophyticus pathogenicity.
We found a high r/m rate in isolates of the S lineage and in strains from UTIs, comparable to naturally transformable bacterial species like Klebsiella pneumoniae and Streptococcus pyogenes (47). A similar phenomenon was observed for S. epidermidis (48); variation in cell surface proteins was shown to contribute to evasion of human immunity (48), and a similar strategy might be advantageous for S. saprophyticus in infection. The recombination might have resulted from defects in repair of double stranded DNA breaks from oxidative stress induced by leukocytes during infection, as previously described (48). However, the mechanism linking infection and recombination in S. saprophyticus remains elusive.
Last, we identified factors associated with infection that could represent new S. saprophyticus virulence factors, including 2 serine-proteases, sraP-like and splE-like, and phages SraP and SplE, which previously were connected to pathogenicity in S. aureus (22,37). In addition, phages have been described to transport pathogenicity islands in staphylococci (49). Our study constitutes a deep-structured analysis of S. saprophyticus population structure and genomic epidemiology, providing groundwork for future studies on the pathogenicity and population genetics of this bacterium.
Dr. Lawal is a postdoctoral researcher at the Instituto de Tecnologia Quimica e Biologica, Universidade Nova de Lisboa (ITQB-NOVA), Oeiras, Portugal. His primary research interests include antimicrobial resistance, bacterial evolution and transmission dynamics of Staphylococcus saprophyticus.
O.U.L. and O.B. cultured the isolates. O.U.L. performed the phenotypic experiments and bioinformatics analysis. O.U.L., H.W., P.W., M.D.B. performed the sequencing of the isolates. O.U.L. and M.M. carried out the data analysis and interpretation and wrote the manuscript. M.J.F., M.L.G., P.P., E.G., C.T., J.E., M.U., H.M.L., H.W., M.D.B. provided the isolates. M.J.F., M.L.G., P.P., E.G., C.T., J.E., M.U., H.M.L., H.W., P.W., M.D.B. were involved in manuscript revision. All authors read and approved the final manuscript.
Acknowledgment
O.U.L. was supported by PhD grants from the Fundação para a Ciência e Tecnologia (FCT) (grant no. PD/BD/113992/2015). This work was partially supported by FCT (project no. PTDC/CVT-CVT/29510/2017), Microbiologia Molecular, Estrutural e Celular (project nos. LISBOA-01-0145-FEDER-007660 and UID/Multi/04378/2019) and by the COMPETE2020 Programa Operacional Competitividade e Internacionalização; ONEIDA (project no. LISBOA-01-0145-FEDER-016417), and co-funded by Fundos Europeus Estruturais e de Investimento from Programa Operacional Regional Lisboa2020 and by national funds through FCT.
References
- Becker K, Heilmann C, Peters G. Coagulase-negative staphylococci. Clin Microbiol Rev. 2014;27:870–926. DOIPubMedGoogle Scholar
- Latham RH, Running K, Stamm WE. Urinary tract infections in young adult women caused by Staphylococcus saprophyticus. JAMA. 1983;250:3063–6. DOIPubMedGoogle Scholar
- Garduño E, Márquez I, Beteta A, Said I, Blanco J, Pineda T. Staphylococcus saprophyticus causing native valve endocarditis. Scand J Infect Dis. 2005;37:690–1. DOIPubMedGoogle Scholar
- Rupp ME, Soper DE, Archer GL. Colonization of the female genital tract with Staphylococcus saprophyticus. J Clin Microbiol. 1992;30:2975–9. DOIPubMedGoogle Scholar
- de Sousa VS, da-Silva APS, Sorenson L, Paschoal RP, Rabello RF, Campana EH, et al. Staphylococcus saprophyticus recovered from humans, food, and recreational waters in Rio de Janeiro, Brazil. Int J Microbiol. 2017;2017:
4287547 . DOIPubMedGoogle Scholar - Hedman P, Ringertz O, Eriksson B, Kvarnfors P, Andersson M, Bengtsson L, et al. Staphylococcus saprophyticus found to be a common contaminant of food. J Infect. 1990;21:11–9. DOIPubMedGoogle Scholar
- Lee B, Jeong D-W, Lee J-H. Genetic diversity and antibiotic resistance of Staphylococcus saprophyticus isolates from fermented foods and clinical samples. J Korean Soc Appl Biol Chem. 2015;58:659–68. DOIGoogle Scholar
- Mortimer TD, Annis DS, O’Neill MB, Bohr LL, Smith TM, Poinar HN, et al. Adaptation in a fibronectin binding autolysin of Staphylococcus saprophyticus. MSphere. 2017;2:e00511–7. DOIPubMedGoogle Scholar
- Kuroda M, Yamashita A, Hirakawa H, Kumano M, Morikawa K, Higashide M, et al. Whole genome sequence of Staphylococcus saprophyticus reveals the pathogenesis of uncomplicated urinary tract infection. Proc Natl Acad Sci U S A. 2005;102:13272–7 . DOIPubMedGoogle Scholar
- Hansen KH, Andreasen MR, Pedersen MS, Westh H, Jelsbak L, Schønning K. Resistance to piperacillin/tazobactam in Escherichia coli resulting from extensive IS26-associated gene amplification of blaTEM-1. J Antimicrob Chemother. 2019;74:3179–83. DOIPubMedGoogle Scholar
- Kaas RS, Leekitcharoenphon P, Aarestrup FM, Lund O. Solving the problem of comparing whole bacterial genomes across different sequencing platforms. PLoS One. 2014;9:
e104984 . DOIPubMedGoogle Scholar - Croucher NJ, Page AJ, Connor TR, Delaney AJ, Keane JA, Bentley SD, et al. Rapid phylogenetic analysis of large samples of recombinant bacterial whole genome sequences using Gubbins. Nucleic Acids Res. 2015;43:
e15 . DOIPubMedGoogle Scholar - Brynildsrud O, Bohlin J, Scheffer L, Eldholm V. Erratum to: Rapid scoring of genes in microbial pan-genome-wide association studies with Scoary. Genome Biol. 2016;17:262. DOIPubMedGoogle Scholar
- Chen L, Zheng D, Liu B, Yang J, Jin Q. VFDB 2016: hierarchical and refined dataset for big data analysis—10 years on. Nucleic Acids Res. 2016;44(D1):D694–7. DOIPubMedGoogle Scholar
- Monk IR, Foster TJ. Genetic manipulation of Staphylococci-breaking through the barrier. Front Cell Infect Microbiol. 2012;2:49. DOIPubMedGoogle Scholar
- Tomita K, Nagura T, Okuhara Y, Nakajima-Adachi H, Shigematsu N, Aritsuka T, et al. Dietary melibiose regulates th cell response and enhances the induction of oral tolerance. Biosci Biotechnol Biochem. 2007;71:2774–80. DOIPubMedGoogle Scholar
- Dinicola S, Minini M, Unfer V, Verna R, Cucina A, Bizzarri M. Nutritional and acquired deficiencies in inositol bioavailability. Correlations with metabolic disorders. Int J Mol Sci. 2017;18:
E2187 . DOIPubMedGoogle Scholar - Gómez FA, Cárdenas C, Henríquez V, Marshall SH. Characterization of a functional toxin-antitoxin module in the genome of the fish pathogen Piscirickettsia salmonis. FEMS Microbiol Lett. 2011;317:83–92. DOIPubMedGoogle Scholar
- Conceição T, Coelho C, de Lencastre H, Aires-de-Sousa M. High prevalence of biocide resistance determinants in Staphylococcus aureus isolates from three African countries. Antimicrob Agents Chemother. 2015;60:678–81. DOIPubMedGoogle Scholar
- Costliow ZA, Degnan PH. Thiamine acquisition strategies impact metabolism and competition in the gut microbe Bacteroides thetaiotaomicron. mSystems. 2017;2:1–17. DOIPubMedGoogle Scholar
- Chekabab SM, Harel J, Dozois CM. Interplay between genetic regulation of phosphate homeostasis and bacterial virulence. Virulence. 2014;5:786–93. DOIPubMedGoogle Scholar
- Sharp JA, Echague CG, Hair PS, Ward MD, Nyalwidhe JO, Geoghegan JA, et al. Staphylococcus aureus surface protein SdrE binds complement regulator factor H as an immune evasion tactic. PLoS One. 2012;7:
e38407 . DOIPubMedGoogle Scholar - Ghali I, Sofyan A, Ohmori H, Shinkai T, Mitsumori M. Diauxic growth of Fibrobacter succinogenes S85 on cellobiose and lactose. FEMS Microbiol Lett. 2017;364:1–9. DOIPubMedGoogle Scholar
- Frankel MB, Hendrickx APA, Missiakas DM, Schneewind O. LytN, a murein hydrolase in the cross-wall compartment of Staphylococcus aureus, is involved in proper bacterial growth and envelope assembly. J Biol Chem. 2011;286:32593–605. DOIPubMedGoogle Scholar
- Hallet B, Sherratt DJ. Transposition and site-specific recombination: adapting DNA cut-and-paste mechanisms to a variety of genetic rearrangements. FEMS Microbiol Rev. 1997;21:157–78. DOIPubMedGoogle Scholar
- García-Gómez E, González-Pedrajo B, Camacho-Arroyo I. Role of sex steroid hormones in bacterial-host interactions. BioMed Res Int. 2013;2013:
928290 . DOIPubMedGoogle Scholar - Datta S, Costantino N, Zhou X, Court DL. Identification and analysis of recombineering functions from Gram-negative and Gram-positive bacteria and their phages. Proc Natl Acad Sci U S A. 2008;105:1626–31. DOIPubMedGoogle Scholar
- Schürch AC, Arredondo-Alonso S, Willems RJL, Goering RV. Whole genome sequencing options for bacterial strain typing and epidemiologic analysis based on single nucleotide polymorphism versus gene-by-gene-based approaches. Clin Microbiol Infect. 2018;24:350–4. DOIPubMedGoogle Scholar
- Ronald A. The etiology of urinary tract infection: traditional and emerging pathogens. Dis Mon. 2003;49:71–82. DOIPubMedGoogle Scholar
- González-García S, Belo S, Dias AC, Rodrigues JV, Da Costa RR, Ferreira A, et al. Life cycle assessment of pigmeat production: Portuguese case study and proposal of improvement options. J Clean Prod. 2015;100:126–39. DOIGoogle Scholar
- Chopra I, Roberts M. Tetracycline antibiotics: mode of action, applications, molecular biology, and epidemiology of bacterial resistance. Microbiol Mol Biol Rev. 2001;65:232–60. DOIPubMedGoogle Scholar
- Walker SW. Laboratory reference ranges. In: Endocrine self-assessment program. Washington, D.C.: Endocrine Society; 2015. p. 1–5 [cited 2019 Apr 29]. https://education.endocrine.org/system/files/ESAP%202015%20Laboratory%20Reference%20Ranges.pdf
- Linhares IM, Minis E, Robial R, Witkin SS. The human vaginal microbiome. In: Faintuch J, Faintuch S, editors. Microbiome and metabolome in diagnosis, therapy, and other strategic applications. London: Elsevier, Inc.; 2019. p. 109–14.
- Clarkson MR, Magee CN, Brenner BM. Chapter 2: Laboratory assessment of kidney disease. In: Clarkson MR, Magee CN, Brenner BM eds. Pocket companion to Brenner and Rector’s the Kidney 8th edition. London: Elsevier; 2011. p. 21–41 [cited 2019 Apr 29]. https://www.sciencedirect.com/science/article/pii/B9781416066408000026
- Frank LA, Mullins R, Rohrbach BW. Variability of estradiol concentration in normal dogs. Vet Dermatol. 2010;21:490–3. DOIPubMedGoogle Scholar
- Flores-Mireles AL, Walker JN, Caparon M, Hultgren SJ. Urinary tract infections: epidemiology, mechanisms of infection and treatment options. Nat Rev Microbiol. 2015;13:269–84. DOIPubMedGoogle Scholar
- Siboo IR, Chaffin DO, Rubens CE, Sullam PM. Characterization of the accessory Sec system of Staphylococcus aureus. J Bacteriol. 2008;190:6188–96. DOIPubMedGoogle Scholar
- King NP, Beatson SA, Totsika M, Ulett GC, Alm RA, Manning PA, et al. UafB is a serine-rich repeat adhesin of Staphylococcus saprophyticus that mediates binding to fibronectin, fibrinogen and human uroepithelial cells. Microbiology (Reading). 2011;157:1161–75. DOIPubMedGoogle Scholar
- Arndt D, Grant JR, Marcu A, Sajed T, Pon A, Liang Y, et al. PHASTER: a better, faster version of the PHAST phage search tool. Nucleic Acids Res. 2016;44(W1):
W16-21 . DOIPubMedGoogle Scholar - Yahara K, Didelot X, Jolley KA, Kobayashi I, Maiden MCJ, Sheppard SK, et al. The landscape of realized homologous recombination in pathogenic bacteria. Mol Biol Evol. 2016;33:456–71. DOIPubMedGoogle Scholar
- Tristan A, Bes M, Meugnier H, Lina G, Bozdogan B, Courvalin P, et al. Global distribution of Panton-Valentine leukocidin—positive methicillin-resistant Staphylococcus aureus, 2006. Emerg Infect Dis. 2007;13:594–600. DOIPubMedGoogle Scholar
- Vincent C, Boerlin P, Daignault D, Dozois CM, Dutil L, Galanakis C, et al. Food reservoir for Escherichia coli causing urinary tract infections. Emerg Infect Dis. 2010;16:88–95. DOIPubMedGoogle Scholar
- Hedman P, Ringertz O, Lindström M, Olsson K. The origin of Staphylococcus saprophyticus from cattle and pigs. Scand J Infect Dis. 1993;25:57–60. DOIPubMedGoogle Scholar
- Verstappen KM, Willems E, Fluit AC, Duim B, Martens M, Wagenaar JA. Staphylococcus aureus nasal colonization differs among pig lineages and is associated with the presence of other staphylococcal species. Front Vet Sci. 2017;4:97. DOIPubMedGoogle Scholar
- Imperi F, Leoni L, Visca P. Antivirulence activity of azithromycin in Pseudomonas aeruginosa. Front Microbiol. 2014;5:178. DOIPubMedGoogle Scholar
- Goerke C, Köller J, Wolz C. Ciprofloxacin and trimethoprim cause phage induction and virulence modulation in Staphylococcus aureus. Antimicrob Agents Chemother. 2006;50:171–7. DOIPubMedGoogle Scholar
- Davies MR, McIntyre L, Mutreja A, Lacey JA, Lees JA, Towers RJ, et al. Atlas of group A streptococcal vaccine candidates compiled using large-scale comparative genomics. Nat Genet. 2019;51:1035–43. DOIPubMedGoogle Scholar
- Méric G, Mageiros L, Pensar J, Laabei M, Yahara K, Pascoe B, et al. Disease-associated genotypes of the commensal skin bacterium Staphylococcus epidermidis. Nat Commun. 2018;9:5034. DOIPubMedGoogle Scholar
- Dearborn AD, Dokland T. Mobilization of pathogenicity islands by Staphylococcus aureus strain Newman bacteriophages. Bacteriophage. 2012;2:70–8. DOIPubMedGoogle Scholar
Figures
Tables
Cite This ArticleOriginal Publication Date: February 09, 2021
Table of Contents – Volume 27, Number 3—March 2021
| EID Search Options |
|---|
|
|
|
|
|
|
Please use the form below to submit correspondence to the authors or contact them at the following address:
Maria Miragaia, Laboratory of Bacterial Evolution and Molecular Epidemiology, Instituto de Tecnologia Química e Biológica, Universidade Nova de Lisboa (ITQB-NOVA), Avenida da República, 2780-157, Oeiras, Portugal
Top