Volume 32, Number 1—January 2026
Research
Enhanced Isolation and Detection of COVID-19 in Hospitalized Patients Undergoing Antiviral Therapy
Figure 7
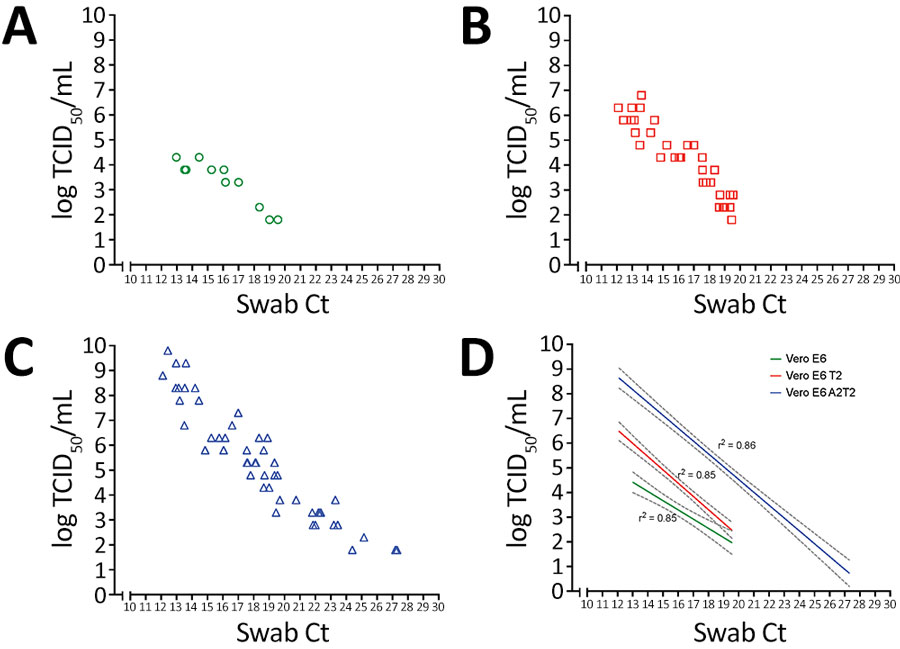
Figure 7. Threshold sensitivity SARS-CoV-2 viral titers by TCID50 assays that used different cell types in upper respiratory tract specimens across a range of Ct values from a study on the enhanced isolation and detection of COVID-19 in hospitalized patients undergoing antiviral therapy. A–C) Viral titers were measured in samples with varying Ct values using TCID50 assays for 3 cell lines: A) Vero E6, B) Vero E6 T2, and C) Vero E6 A2T2. D) Pearson correlation coefficient of the respiratory viral titers determined by each cell line versus the Ct value. Dotted lines indicate 95% CIs. Ct, cycle threshold; TCID50, 50% tissue culture infectious dose; Vero E6 T2, Vero E6 cells expressing transmembrane protease serine 2; Vero E6 A2T2, Vero E6 cells expressing both transmembrane protease serine 2 and angiotensin-converting enzyme 2.