Volume 11, Number 3—March 2005
Research
Rapid Identification of Emerging Pathogens: Coronavirus
Figure 3
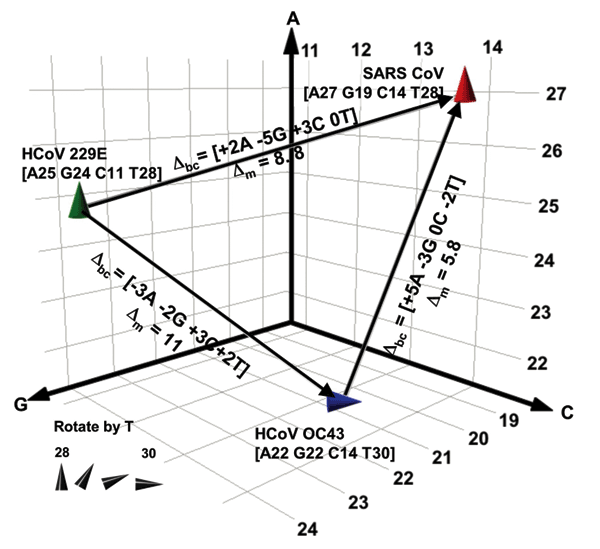
Figure 3. . Spatial representation of base compositions for the 3 coronavirus (CoV) species known to infect humans. Severe acute respiratory syndrome (SARS), HCoV-OC43, and HCoV-229E base compositions in the region amplified by RNA-dependent RNA polymerase primers (Table 1) are plotted on the A, G, and C axes. T counts are shown by the tilt of the symbol. Within a species, all known isolates of each virus (37 isolates for SARS, 4 for HCoV-229E, and 2 for OC43) had identical sequences in this region. Δbc represents the number of changes in the A, G, C, and T bases needed for 1 species to be misidentified as another in the direction of the arrow. Δm represents the pairwise mutation distance between 2 species, or the cumulative probability of Δbc occurring.