Volume 11, Number 3—March 2005
Research
Rapid Identification of Emerging Pathogens: Coronavirus
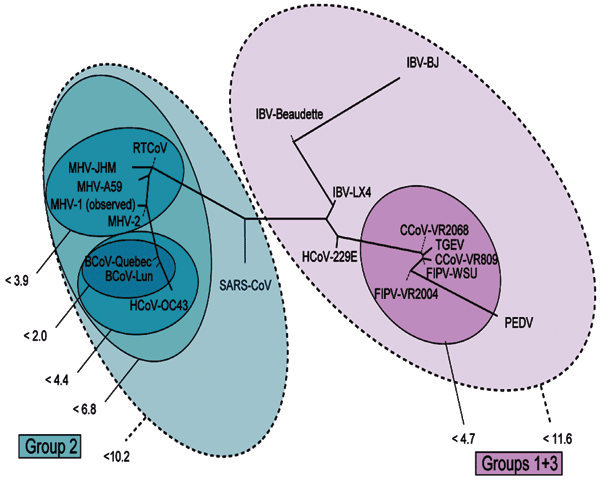
Figure 4

Figure 4. . Representation of the mutational distances calculated for the 2 selected primer sets overlaid on the coronavirus phylogenetic tree. Each oval represents grouping of members contained within it; numbers next to the group indicate the maximum distance between any 2 members of the group. Distances are computed as the base 10 logarithm of the geometric average of the pair-wise probabilities for any given pair of base compositions.
Page created: April 25, 2012
Page updated: April 25, 2012
Page reviewed: April 25, 2012
The conclusions, findings, and opinions expressed by authors contributing to this journal do not necessarily reflect the official position of the U.S. Department of Health and Human Services, the Public Health Service, the Centers for Disease Control and Prevention, or the authors' affiliated institutions. Use of trade names is for identification only and does not imply endorsement by any of the groups named above.