Skip directly to site content Skip directly to page options Skip directly to A-Z link Skip directly to A-Z link Skip directly to A-Z link

Disclaimer: Early release articles are not considered as final versions. Any changes will be reflected in the online version in the month the article is officially released.

Volume 31, Number 3—March 2025
Research

Influenza A(H5N1) Immune Response among Ferrets with Influenza A(H1N1)pdm09 Immunity

Valerie Le SageComments to Author , Bailee D. Werner, Grace A. Merrbach, Sarah E. Petnuch, Aoife K. O’Connell, Holly C. Simmons, Kevin R. McCarthy, Douglas S. Reed, Louise H. Moncla, Disha Bhavsar, Florian Krammer, Nicholas A. Crossland, Anita K. McElroy, W. Paul Duprex, and Seema S. Lakdawala
Author affiliation: Author affiliations: University of Pittsburgh, Pittsburgh, Pennsylvania, USA (V. Le Sage, B.D. Werner, G.A. Merrbach, S.E. Petnuch, H.C. Simmons, K.R. McCarthy, D.S. Reed, L.H. Moncla, A.K. McElroy, W.P. Duprex); Boston University, Boston, Massachusetts, USA (A.K. O’Connell, N.A. Crossland); Icahn School of Medicine at Mount Sinai, New York, New York, USA (D. Bhavsar, F. Krammer); Medical University of Vienna, Vienna, Austria (F. Krammer); Boston University Chobanian & Avedisian School of Medicine, Boston, Massachusetts, USA (N.A. Crossland); Emory University, Atlanta, Georgia, USA (S.S. Lakdawala)

Main Article

Figure 2

Infection timeline and virus replication titers in a study of influenza A(H5N1) immune response among ferrets with pH1N1 immunity. A) Schematic of experimental timeline for 2 groups of ferrets intranasally infected with H5N1 strain cow/Tx/24. Group 1 (n = 5) was previously infected with pH1N1 98 days before  H5N1 infection and group 2 (n = 5) was immunologically naive. At 3 dpi, 3 animals from each group were humanely euthanized. We monitored the remaining ferrets from groups 1 and 2 until 14 dpi or until the endpoint criteria were reached. Schematic was created in BioRender (https://www.biorender.com). B, C). Viral titers from ferret tissues (B) and nasal secretions (C). B) Tissues were collected from H5N1-infected ferrets without (n = 3) and with (n = 3) pH1N1 immunity at 3 days postinfection. Unpaired t-test analysis was used to determine statistically significant (p<0.05) differences: lungs, p = 0.0124; trachea, p<0.008; soft palate, p = 0.0072; nasal turbinate, p = 0.0061; small intestine, p = 0.0014. C) Nasal wash samples were collected from H5N1-infected ferrets without (n = 5) and with (n = 5) pH1N1 immunity on the indicated dpi: 1–3 dpi, n = 5 from each group; 4 dpi, n = 2 from each group; 5 and 6 dpi, n = 2 for immune group and n = 1 from the naive group; 7 dpi, n = 2 from the immune group . Each circle represents a single ferret. Open circles indicate values above the limit of detection. Horizontal bars indicate means; whiskers indicate SDs of viral titers; dashed line represents the limit of detection. cow/Tx/24, A/dairy cattle/Texas/24-008749-001/2024(H5N1); dpi, days postinfection; NT, nasal turbinate; pH1N1, influenza A(H1N1)pdm09; TCID50, 50% tissue culture infectious dose.

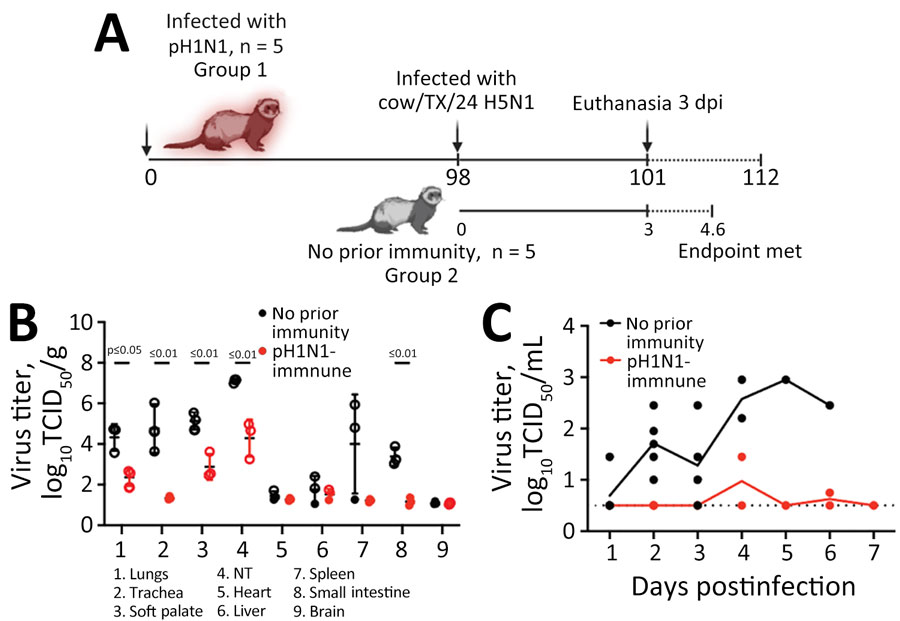
Figure 2. Infection timeline and virus replication titers in a study of influenza A(H5N1) immune response among ferrets with pH1N1 immunity. A) Schematic of experimental timeline for 2 groups of ferrets intranasally infected with H5N1 strain cow/Tx/24. Group 1 (n = 5) was previously infected with pH1N1 98 days before H5N1 infection and group 2 (n = 5) was immunologically naive. At 3 dpi, 3 animals from each group were humanely euthanized. We monitored the remaining ferrets from groups 1 and 2 until 14 dpi or until the endpoint criteria were reached. Schematic was created in BioRender (https://www.biorender.com). B, C). Viral titers from ferret tissues (B) and nasal secretions (C). B) Tissues were collected from H5N1-infected ferrets without (n = 3) and with (n = 3) pH1N1 immunity at 3 days postinfection. Unpaired t-test analysis was used to determine statistically significant (p<0.05) differences: lungs, p = 0.0124; trachea, p<0.008; soft palate, p = 0.0072; nasal turbinate, p = 0.0061; small intestine, p = 0.0014. C) Nasal wash samples were collected from H5N1-infected ferrets without (n = 5) and with (n = 5) pH1N1 immunity on the indicated dpi: 1–3 dpi, n = 5 from each group; 4 dpi, n = 2 from each group; 5 and 6 dpi, n = 2 for immune group and n = 1 from the naive group; 7 dpi, n = 2 from the immune group . Each circle represents a single ferret. Open circles indicate values above the limit of detection. Horizontal bars indicate means; whiskers indicate SDs of viral titers; dashed line represents the limit of detection. cow/Tx/24, A/dairy cattle/Texas/24-008749-001/2024(H5N1); dpi, days postinfection; NT, nasal turbinate; pH1N1, influenza A(H1N1)pdm09; TCID50, 50% tissue culture infectious dose.

Main Article

Page created: January 21, 2025
Page updated: February 21, 2025
Page reviewed: February 21, 2025
The conclusions, findings, and opinions expressed by authors contributing to this journal do not necessarily reflect the official position of the U.S. Department of Health and Human Services, the Public Health Service, the Centers for Disease Control and Prevention, or the authors' affiliated institutions. Use of trade names is for identification only and does not imply endorsement by any of the groups named above.
file_external