Volume 32, Supplement –Summer 2026
SUPPLEMENT ISSUE
Supplement
Evaluation of Detection Methods for Wastewater Surveillance of Antimicrobial-Resistant Bacteria from Healthcare Facilities

Figure 1
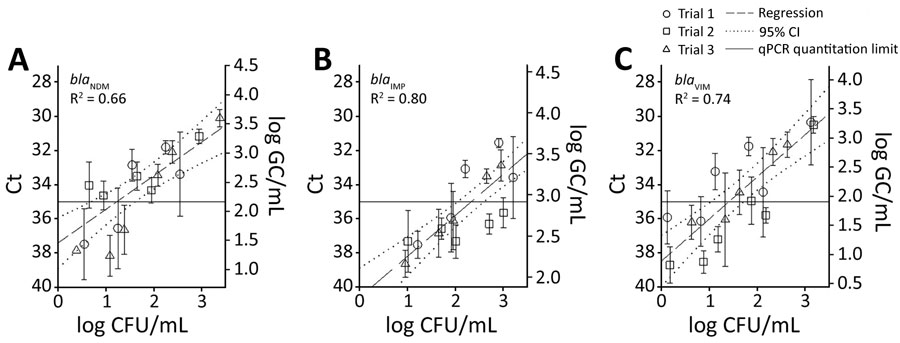
Figure 1. Measured Ct (mean +SD), calculated log GC/mL, and extrapolated log CFU/mL for detection limit studies in study of detection methods for wastewater surveillance of antimicrobial-resistant bacteria from healthcare facilities. A) blaNDM; B) blaIMP; C) blaVIM. Each point represents 5 replicates. Horizontal line represents a Ct cutoff of 35 cycles. All data points were included in the linear regression for each plot; dashed lines represent 95% CIs of the regression. The log CFU/mL was extrapolated from the initial isolate concentration, which was then serially diluted by 6 log into each of 5 replicates. The log GC/mL was estimated from the Ct response from standard curves using either geneblock DNA or antimicrobial-resistant isolates as positive controls. Ct, cycle threshold; GC, gene copies