Volume 32, Number 9—September 2026
Research
Clustering and Source Association of Clinical and Nonclinical Listeria monocytogenes Isolates, New York, USA, 2000–20211
Hilal Samut, Damaris V. Mendez-Vallellanes, Hannah Hoyt, Samantha E. Wirth, Lisa Mingle, Brian D. Sauders, Gregory A. Deiulio, Alyssa W. Dickey, Maria L. Ishida, William J. Wolfgang, Kimberlee A. Musser, Martin Wiedmann, and Renato H. Orsi
Figure 4
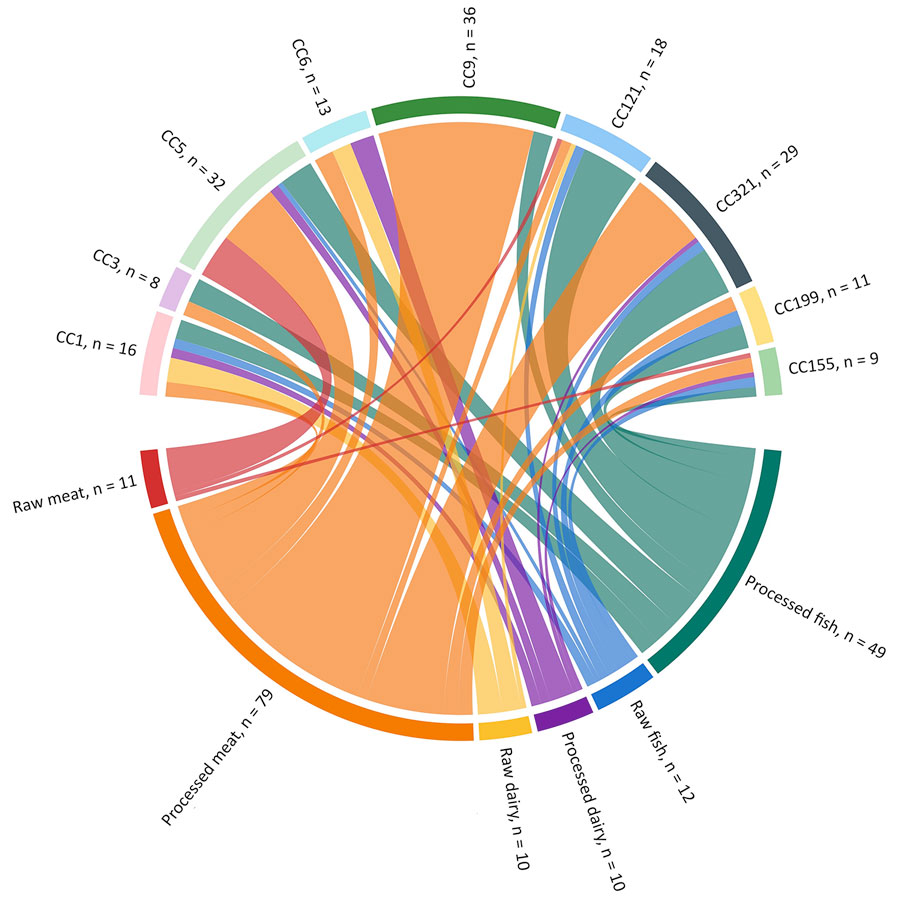
Figure 4. Sankey diagram showing the distribution of Listeria monocytogenes CCs across major food categories in study of clustering and source association of clinical and nonclinical L. monocytogenes isolates, New York, USA, 2000–2021. Only CCs with >10 food isolates are shown. Food categories with <20 isolates (e.g., produce, salad, pasta, nuts, and sandwiches) were excluded for clarity. The width of each flow is proportional to the number of isolates linked with a specific food category (bottom) and a CC (top). CC, clonal complex.
1Preliminary results from this study were presented at the 2025 International Association for Food Protection Conference; July 27–30, 2025; Cleveland, Ohio, USA.
Page created: July 30, 2026
Page updated: August 26, 2026
Page reviewed: August 26, 2026
The conclusions, findings, and opinions expressed by authors contributing to this journal do not necessarily reflect the official position of the U.S. Department of Health and Human Services, the Public Health Service, the Centers for Disease Control and Prevention, or the authors' affiliated institutions. Use of trade names is for identification only and does not imply endorsement by any of the groups named above.