Skip directly to site content Skip directly to page options Skip directly to A-Z link Skip directly to A-Z link Skip directly to A-Z link

Disclaimer: Early release articles are not considered as final versions. Any changes will be reflected in the online version in the month the article is officially released.

Volume 32, Number 9—September 2026

Research

Clustering and Source Association of Clinical and Nonclinical Listeria monocytogenes Isolates, New York, USA, 2000–20211

Hilal Samut, Damaris V. Mendez-Vallellanes, Hannah Hoyt, Samantha E. Wirth, Lisa Mingle, Brian D. Sauders, Gregory A. Deiulio, Alyssa W. Dickey, Maria L. Ishida, William J. Wolfgang, Kimberlee A. Musser, Martin Wiedmann, and Renato H. OrsiComments to Author 
Author affiliation: Cornell University, Ithaca, New York, USA (H. Samut, M. Wiedmann, R.H. Orsi); New York State Department of Health, Wadsworth Center, Albany, New York, USA (D.V. Mendez-Vallellanes, H. Hoyt, S.E. Wirth, L. Mingle, W.J. Wolfgang, K.A. Musser); New York State Department of Agriculture and Markets, Albany (B.D. Sauders, G.A. Deiulio, A.W. Dickey, M.L. Ishida)

Main Article

Figure 5

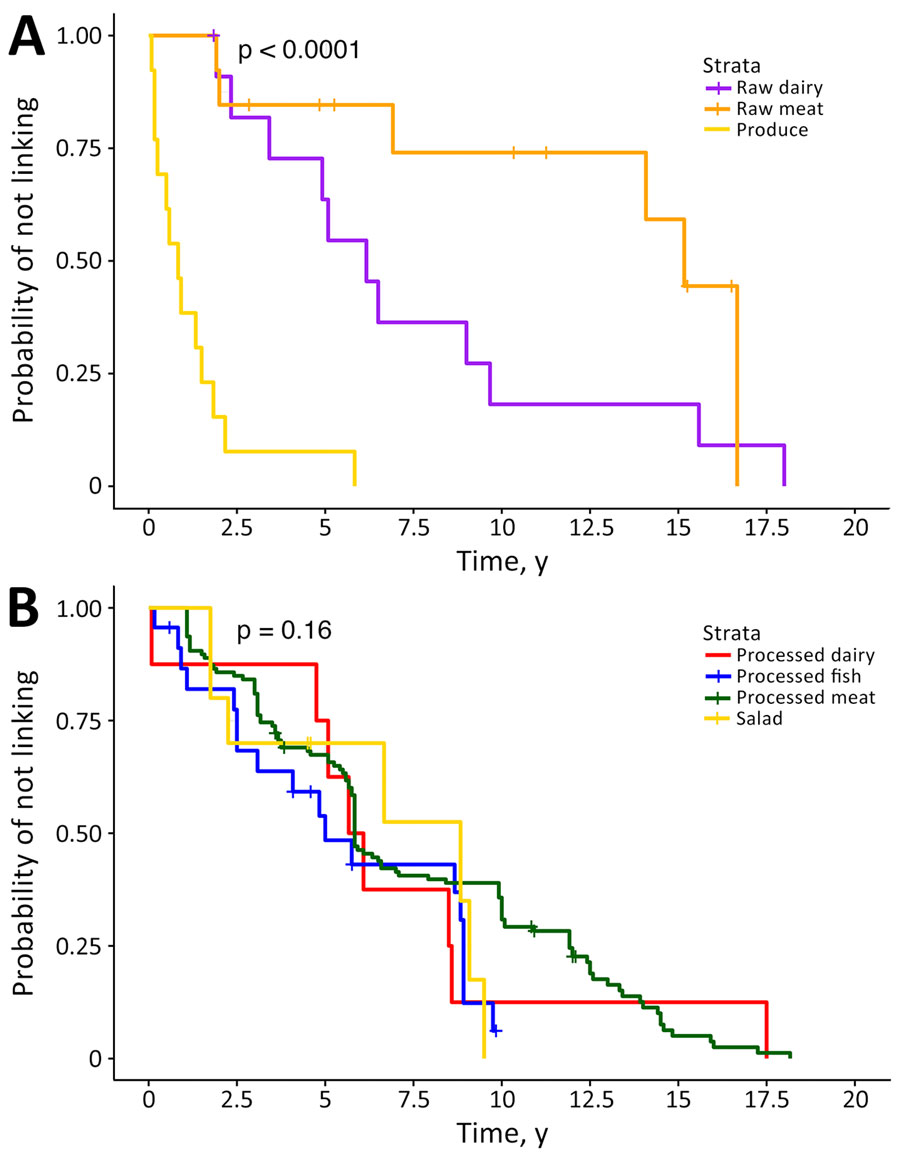
Kaplan-Meier survival curves for the time between food isolate collection and subsequent detection of a genetically related clinical Listeria monocytogenes isolate (single-nucleotide polymorphisms <50) by food category in study of clustering and source association of clinical and nonclinical L. monocytogenes isolates, New York, USA, 2000–2021. p<0.0001 indicates a significant difference in time between food isolate collection and subsequent detection of genetically related clinical isolate by single-nucleotide polymorphism cluster across food categories. A) Raw food categories (produce, raw meat and raw dairy); B) processed food categories (processed dairy, processed fish, processed meat, and salad). Salad refers to ready-to-eat mixed products that might involve additional handling steps and potential contamination during preparation or in retail establishments.

Figure 5. Kaplan-Meier survival curves for the time between food isolate collection and subsequent detection of a genetically related clinical Listeria monocytogenes isolate (single-nucleotide polymorphisms <50) by food category in study of clustering and source association of clinical and nonclinical L. monocytogenes isolates, New York, USA, 2000–2021. p<0.0001 indicates a significant difference in time between food isolate collection and subsequent detection of genetically related clinical isolate by single-nucleotide polymorphism cluster across food categories. A) Raw food categories (produce, raw meat and raw dairy); B) processed food categories (processed dairy, processed fish, processed meat, and salad). Salad refers to ready-to-eat mixed products that might involve additional handling steps and potential contamination during preparation or in retail establishments.

Main Article

1Preliminary results from this study were presented at the 2025 International Association for Food Protection Conference; July 27–30, 2025; Cleveland, Ohio, USA.

Page created: July 30, 2026
Page updated: August 17, 2026
Page reviewed: August 17, 2026
The conclusions, findings, and opinions expressed by authors contributing to this journal do not necessarily reflect the official position of the U.S. Department of Health and Human Services, the Public Health Service, the Centers for Disease Control and Prevention, or the authors' affiliated institutions. Use of trade names is for identification only and does not imply endorsement by any of the groups named above.
file_external