Volume 27, Number 3—March 2021
Research
Daily Forecasting of Regional Epidemics of Coronavirus Disease with Bayesian Uncertainty Quantification, United States
Figure 1
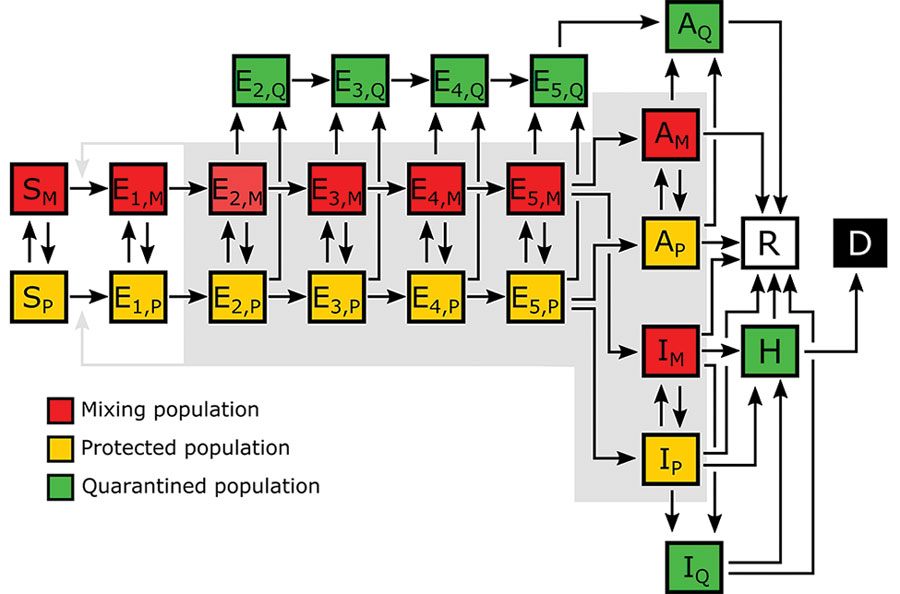
Figure 1. Illustration of the populations and processes considered in a mechanistic compartmental model of coronavirus disease daily incidence during regional epidemics, United States, 2020. The model accounts for susceptible persons (S), exposed persons without symptoms in the incubation phase of disease (E), asymptomatic persons in the immune clearance phase of disease (A), mildly ill symptomatic persons (I), severely ill persons in hospital or at home (H), recovered persons (R), and deceased persons (D). The model also accounts for social distancing, which establishes mixing (M) and protected (P) subpopulations; quarantine driven by testing and contact tracing, which establishes quarantined subpopulations (Q); and self-isolation spurred by symptom awareness. Persons who are self-isolating because of symptoms are considered to be members of the IQ population. The incubation period is divided into 5 stages (E1–E5), which enables the model to reproduce an empirically determined (nonexponential) Erlang distribution of waiting times for the onset of symptoms after infection (12). The exposed population consists of persons incubating virus and is comprised of presymptomatic and asymptomatic persons. The A populations consist of asymptomatic persons in the immune clearance phase. The gray background indicates the populations that contribute to disease transmission. An auxiliary measurement model (Appendix Equations 23, 24) accounts for imperfect detection and reporting of new cases. Only symptomatic cases are assumed to be detectable in surveillance testing. Red indicates the mixing population; yellow indicates the protected population; green indicates the quarantined population; white indicates the recovered population; black indicates the deceased population.
References
- Gorbalenya AE, Baker SC, Baric RS, de Groot RJ, Drostetn C, Gulyaeva AA, et al.; Coronaviridae Study Group of the International Committee on Taxonomy of Viruses. The species Severe acute respiratory syndrome-related coronavirus: classifying 2019-nCoV and naming it SARS-CoV-2. Nat Microbiol. 2020;5:536–44. DOIPubMedGoogle Scholar
- Ghinai I, McPherson TD, Hunter JC, Kirking HL, Christiansen D, Joshi K, et al.; Illinois COVID-19 Investigation Team. First known person-to-person transmission of severe acute respiratory syndrome coronavirus 2 (SARS-CoV-2) in the USA. Lancet. 2020;395:1137–44. DOIPubMedGoogle Scholar
- Holshue ML, DeBolt C, Lindquist S, Lofy KH, Wiesman J, Bruce H, et al.; Washington State 2019-nCoV Case Investigation Team. First case of 2019 novel coronavirus in the United States. N Engl J Med. 2020;382:929–36. DOIPubMedGoogle Scholar
- The Atlantic Monthly Group. The COVID Tracking Project. 2020 [cited 2020 Jul 1]. https://covidtracking.com/data/national
- Silverman JD, Hupert N, Washburne AD. Using influenza surveillance networks to estimate state-specific prevalence of SARS-CoV-2 in the United States. Sci Transl Med. 2020;12:
eabc1126 . DOIPubMedGoogle Scholar - Sanche S, Lin YT, Xu C, Romero-Severson E, Hengartner N, Ke R. High contagiousness and rapid spread of severe acute respiratory syndrome coronavirus 2. Emerg Infect Dis. 2020;26:1470–7. DOIPubMedGoogle Scholar
- Coronavirus Resource Center, Johns Hopkins University. Timeline of COVID-19 policies, cases, and deaths in your state: a look at how social distancing measures may have influenced trends in COVID-19 cases and deaths. 2020 [2020 Jul 1]. https://coronavirus.jhu.edu/data/state-timeline
- Courtemanche C, Garuccio J, Le A, Pinkston J, Yelowitz A. Strong social distancing measures in the United States reduced the COVID-19 growth rate. Health Aff (Millwood). 2020;39:1237–46. DOIPubMedGoogle Scholar
- Hsiang S, Allen D, Annan-Phan S, Bell K, Bolliger I, Chong T, et al. The effect of large-scale anti-contagion policies on the COVID-19 pandemic. Nature. 2020;584:262–7. DOIPubMedGoogle Scholar
- Executive Office of the President. OMB bulletin no. 15-01. 2020 [cited 2020 Jul 1]. https://www.bls.gov/bls/omb-bulletin-15-01-revised-delineations-of-metropolitan-statistical-areas.pdf
- The New York Times. Coronavirus (Covid-19) data in the United States. 2020 [cited 2020 Jul 1]. https://github.com/nytimes/covid-19-data
- Lauer SA, Grantz KH, Bi Q, Jones FK, Zheng Q, Meredith HR, et al. The incubation period of coronavirus disease 2019 (COVID-19) from publicly reported confirmed cases: estimation and application. Ann Intern Med. 2020;172:577–82. DOIPubMedGoogle Scholar
- United States Census Bureau. Metropolitan and micropolitan statistical areas population totals and components of change: 2010–2019. 2020 [cited 2020 Jul 1]. https://www.census.gov/data/tables/time-series/demo/popest/2010s-total-metro-and-micro-statistical-areas.html
- Arons MM, Hatfield KM, Reddy SC, Kimball A, James A, Jacobs JR, et al.; Public Health–Seattle and King County; CDC COVID-19 Investigation Team. Presymptomatic SARS-CoV-2 infections and transmission in a skilled nursing facility. N Engl J Med. 2020;382:2081–90. DOIPubMedGoogle Scholar
- Nguyen VVC, Vo TL, Nguyen TD, Lam MY, Ngo NQM, Le MH, et al. The natural history and transmission potential of asymptomatic SARS-CoV-2 infection. Clin Infect Dis 2020 Jun 4 [Epub ahead of print].
- Ministry of Health, Labour and Welfare of Japan. Official report on the cruise ship Diamond Princess, May 1, 2020. 2020 [cited 2020 Jul 1]. https://www.mhlw.go.jp/stf/newpage_11146.html
- Sakurai A, Sasaki T, Kato S, Hayashi M, Tsuzuki SI, Ishihara T, et al. Natural history of asymptomatic SARS-CoV-2 infection. N Engl J Med. 2020;383:885–6. DOIPubMedGoogle Scholar
- Perez-Saez J, Lauer SA, Kaiser L, Regard S, Delaporte E, Guessous I, et al. Serology-informed estimates of SARS-COV-2 infection fatality risk in Geneva, Switzerland. Lancet Infect Dis. 2020 Jul 14 [Epub ahead of print]. https://doi.org/10.1016/S1473-3099(20)30584-3
- Richardson S, Hirsch JS, Narasimhan M, Crawford JM, McGinn T, Davidson KW, et al.; the Northwell COVID-19 Research Consortium. Presenting characteristics, comorbidities, and outcomes among 5700 patients hospitalized with COVID-19 in the New York City area. JAMA. 2020;323:2052–9. DOIPubMedGoogle Scholar
- Wölfel R, Corman VM, Guggemos W, Seilmaier M, Zange S, Müller MA, et al. Virological assessment of hospitalized patients with COVID-2019. Nature. 2020;581:465–9. DOIPubMedGoogle Scholar
- Hindmarsh AC. ODEPACK, a systematized collection of ODE solvers. In: Stepleman RS, editor. Scientific computing: applications of mathematics and computing to the physical sciences. Amsterdam: North-Holland Publishing Company; 1983. p. 55–64.
- U.S. Department of Energy. COVID-19 pandemic modeling and analysis. 2020 [cited 2020 Jul 1]. https://covid19.ornl.gov
- Lin YT, Neumann J, Miller EF, Posner RG, Mallela A, Safta C, et al. Los Alamos COVID-19 city predictions. 2020 [cited 2020 Jul 1]. https://github.com/lanl/COVID-19-Predictions.