Volume 27, Number 3—March 2021
Research
Daily Forecasting of Regional Epidemics of Coronavirus Disease with Bayesian Uncertainty Quantification, United States
Figure 3
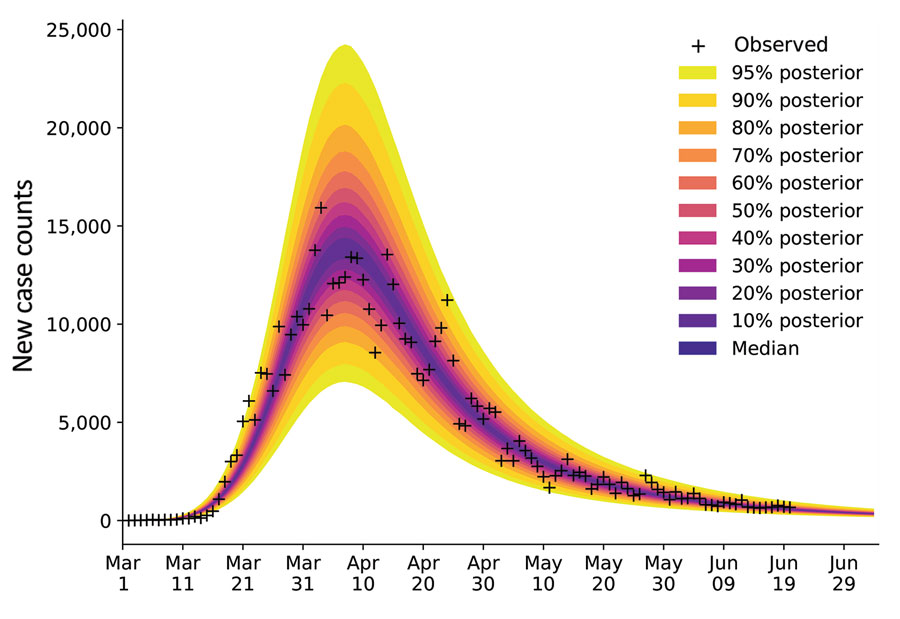
Figure 3. Illustration of Bayesian predictive inference for daily new case counts of coronavirus disease in the New York City, New York, metropolitan statistical area, United States, March 1–June 21, 2020. Daily reports of new cases forecasted with rigorous uncertainty quantification through online Bayesian learning of model parameters. Each day considers all daily case-reporting data available up to that point. We conducted Markov chain Monte Carlo sampling of the posterior distribution for a set of adjustable parameters. Subsampling of the posterior samples enabled the relevant model to generate trajectories of the epidemic curve that account for parametric and observation uncertainty. Crosses indicate observed daily case reports. The shaded region indicates the 95% credible interval for predictions of daily case reports. The color-coded bands within the shaded region indicate alternate credible intervals. The model was parametrized with uncertainty quantification data from January 21–June 21, 2020. The uncertainty bands/inferred model was used to make predictions for 14 days after the last observed data: the last prediction date was July 5, 2020.