Skip directly to site content Skip directly to page options Skip directly to A-Z link Skip directly to A-Z link Skip directly to A-Z link
Volume 27, Number 3—March 2021
Research

Daily Forecasting of Regional Epidemics of Coronavirus Disease with Bayesian Uncertainty Quantification, United States

Yen Ting LinComments to Author , Jacob Neumann, Ely F. Miller, Richard G. Posner, Abhishek Mallela, Cosmin Safta, Jaideep Ray, Gautam Thakur, Supriya Chinthavali, and William S. Hlavacek
Author affiliations: Los Alamos National Laboratory, Los Alamos, New Mexico, USA (Y.T. Lin, W.S. Hlavacek); Northern Arizona University, Flagstaff, Arizona, USA (J. Neumann, E.F. Miller, R.G. Posner); University of California, Davis, California, USA (A. Mallela); Sandia National Laboratories, Livermore, California, USA (C. Safta, J. Ray); Oak Ridge National Laboratory, Oak Ridge, Tennessee, USA (G. Thakur, S. Chinthavali)

Main Article

Figure 4

Bayesian predictive inferences for daily new case counts of coronavirus disease in the 15 most populous metropolitan statistical areas, United States, March 1–June 21, 2020. Predictions conditioned on the compartmental model with structure defined by n = 0, which accounts for a single initial period of social distancing. Inferences shown for the metropolitan statistical areas for the following cities: A) New York City, New York; B) Los Angeles, California; C) Chicago, Illinois; D) Dallas, Texas; E) Houston, Texas; F) Washington, DC; G) Miami, Florida; H) Philadelphia, Pennsylvania; I) Atlanta, Georgia; J) Phoenix, Arizona; K) Boston, Massachusetts; L) San Francisco, California; M) Riverside, California; N) Detroit, Michigan; and O) Seattle, Washington. Crosses indicate observed daily case reports. The shaded region indicates the 95% credible interval for predictions of daily case reports. The color-coded bands within the shaded region indicate alternate credible intervals. The model was parametrized with uncertainty quantification by using data from January 21–June 21, 2020. The uncertainty bands/inferred model was used to make predictions for 14 days after the last observed data: the last prediction date was July 5, 2020.

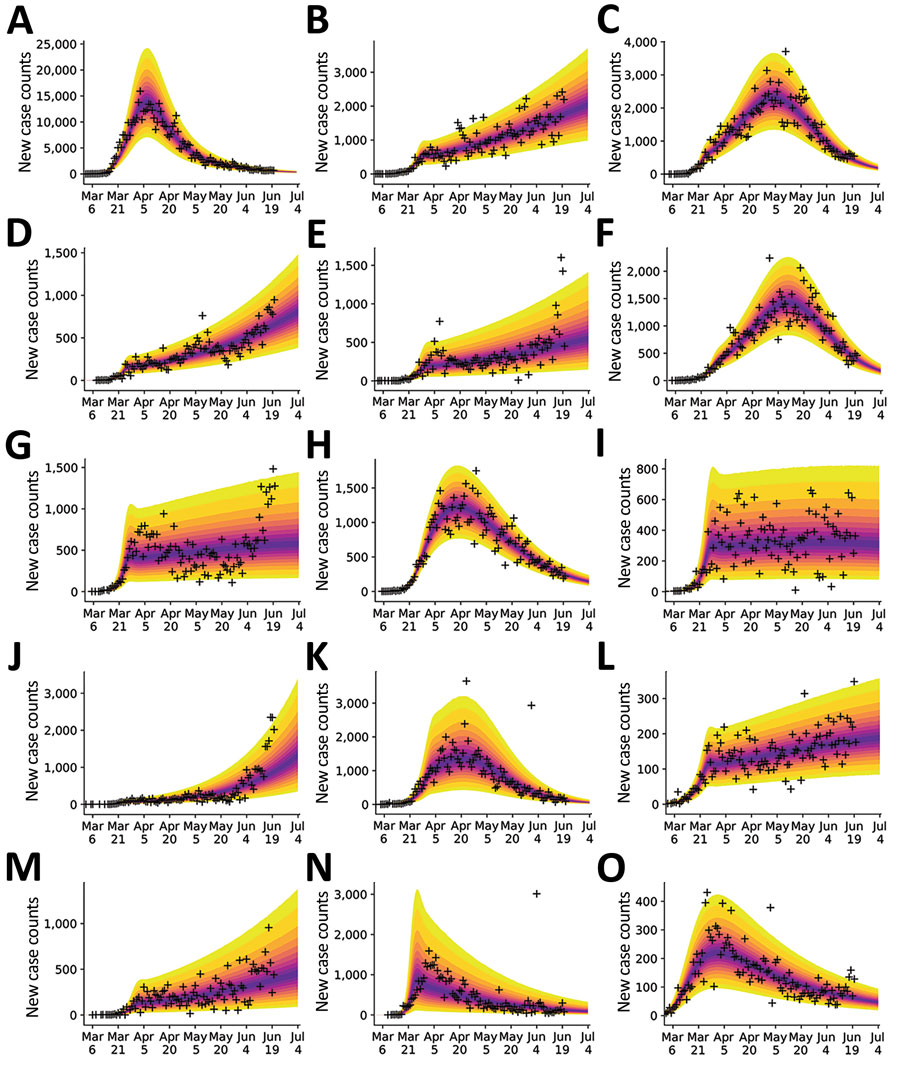
Figure 4. Bayesian predictive inferences for daily new case counts of coronavirus disease in the 15 most populous metropolitan statistical areas, United States, March 1–June 21, 2020. Predictions conditioned on the compartmental model with structure defined by n = 0, which accounts for a single initial period of social distancing. Inferences shown for the metropolitan statistical areas for the following cities: A) New York City, New York; B) Los Angeles, California; C) Chicago, Illinois; D) Dallas, Texas; E) Houston, Texas; F) Washington, DC; G) Miami, Florida; H) Philadelphia, Pennsylvania; I) Atlanta, Georgia; J) Phoenix, Arizona; K) Boston, Massachusetts; L) San Francisco, California; M) Riverside, California; N) Detroit, Michigan; and O) Seattle, Washington. Crosses indicate observed daily case reports. The shaded region indicates the 95% credible interval for predictions of daily case reports. The color-coded bands within the shaded region indicate alternate credible intervals. The model was parametrized with uncertainty quantification by using data from January 21–June 21, 2020. The uncertainty bands/inferred model was used to make predictions for 14 days after the last observed data: the last prediction date was July 5, 2020.

Main Article

Page created: January 20, 2021
Page updated: February 21, 2021
Page reviewed: February 21, 2021
The conclusions, findings, and opinions expressed by authors contributing to this journal do not necessarily reflect the official position of the U.S. Department of Health and Human Services, the Public Health Service, the Centers for Disease Control and Prevention, or the authors' affiliated institutions. Use of trade names is for identification only and does not imply endorsement by any of the groups named above.
file_external