Volume 27, Number 3—March 2021
Research
Daily Forecasting of Regional Epidemics of Coronavirus Disease with Bayesian Uncertainty Quantification, United States
Figure 5
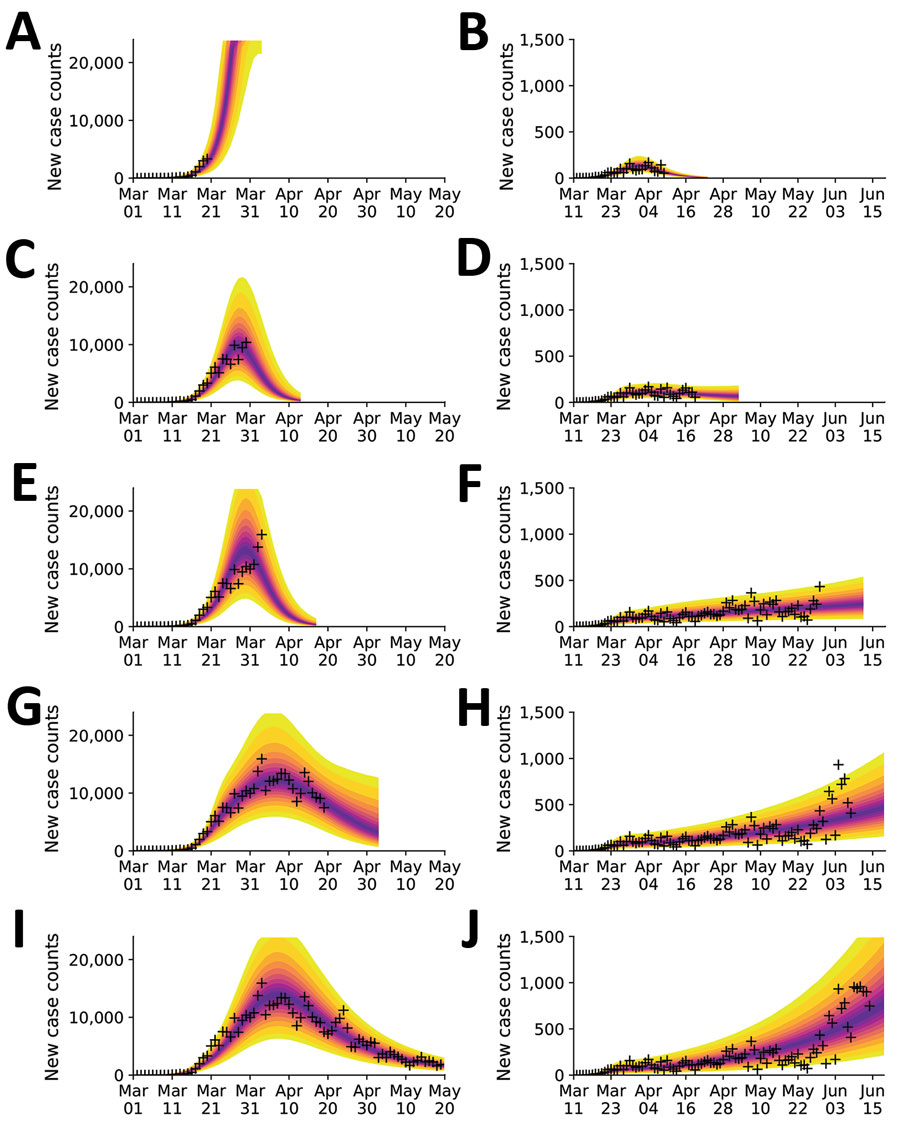
Figure 5. Illustration of the need for online learning for modeling daily new case counts of coronavirus disease in the New York City, New York, and Phoenix, Arizona, metropolitan statistical areas, United States, 2020. Predictions made over a series of progressively later dates as indicated for the New York City area (A, C, E, G, I) and the Phoenix area (B, D, F, H, J). Predictive inferences are data driven and conditioned on a compartmental model. Crosses indicate observed daily case reports. The shaded region indicates the 95% credible interval for predictions of daily case reports. The color-coded bands within the shaded region indicate alternate credible intervals. Predictions are accurate but only over a finite period of time into the future. New data must be considered as these data become available to maintain prediction accuracy. The model was parametrized with uncertainty quantification using all data up to a terminal date, which differs in each panel. The uncertainty bands/inferred model was used to make predictions for 14 days after the last observed data point. For the New York City area, visualization began on March 1, 2020; the terminal dates were A) March 20, C) March 30, E) April 3, G) April 19, and I) May 19, 2020. For the Phoenix area, visualization began on March 11, 2020; the terminal dates were B) April 9, D) April 19, F) May 29, H) June 8, and J) June 18, 2020.