Volume 27, Number 3—March 2021
Research
Daily Forecasting of Regional Epidemics of Coronavirus Disease with Bayesian Uncertainty Quantification, United States
Yen Ting Lin , Jacob Neumann, Ely F. Miller, Richard G. Posner, Abhishek Mallela, Cosmin Safta, Jaideep Ray, Gautam Thakur, Supriya Chinthavali, and William S. Hlavacek
Figure 7
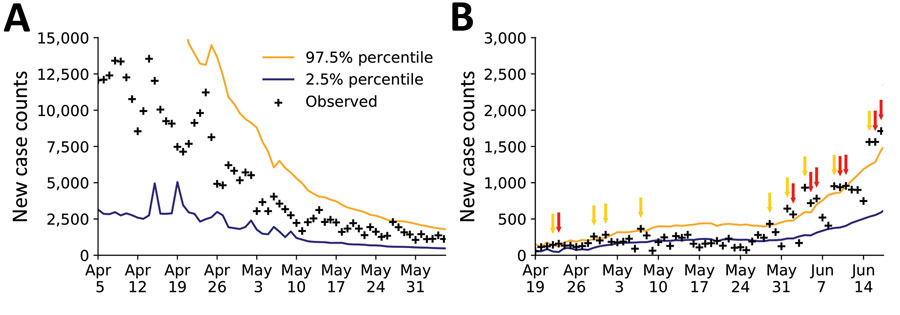
Figure 7. Rare events and anomalies in daily new case counts of coronavirus disease in (A) the New York City, New York metropolitan statistical area during April 5–June 4, 2020 and (B) Phoenix, Arizona, metropolitan statistical area during April 19–June 18, 2020, United States. Crosses indicate observed daily case reports. Orange line indicates 97.5% probability percentile; blue line indicates 2.5% probability percentile. Yellow arrows mark upward-trending rare events. Red arrows mark upward-trending anomalies.
Page created: January 20, 2021
Page updated: February 21, 2021
Page reviewed: February 21, 2021
The conclusions, findings, and opinions expressed by authors contributing to this journal do not necessarily reflect the official position of the U.S. Department of Health and Human Services, the Public Health Service, the Centers for Disease Control and Prevention, or the authors' affiliated institutions. Use of trade names is for identification only and does not imply endorsement by any of the groups named above.