Volume 27, Number 5—May 2021
Research
Susceptibility to SARS-CoV-2 of Cell Lines and Substrates Commonly Used to Diagnose and Isolate Influenza and Other Viruses
Li Wang, Xiaoyu Fan, Gaston Bonenfant, Dan Cui, Jaber Hossain, Nannan Jiang, Gloria Larson, Michael Currier, Jimma Liddell, Malania Wilson, Azaibi Tamin, Jennifer Harcourt, Jessica Ciomperlik-Patton, Hong Pang, Naomi Dybdahl-Sissoko, Ray Campagnoli, Pei-Yong Shi, John Barnes, Natalie J. Thornburg, David E. Wentworth, and Bin Zhou
Figure 4
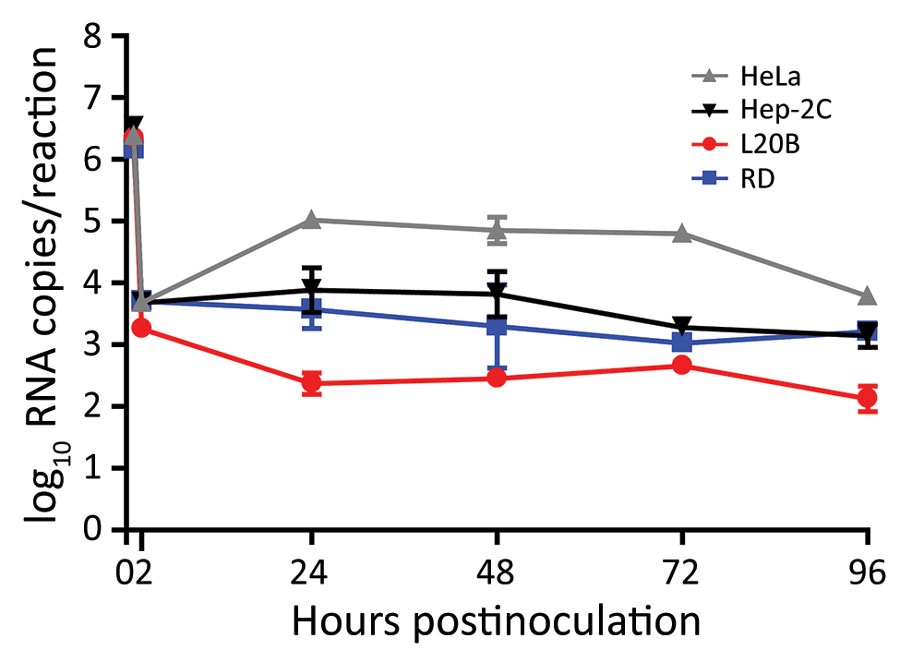
Figure 4. Poliovirus and enterovirus substrates not infected by severe acute respiratory syndrome coronavirus 2 (SARS-CoV-2) in study of susceptibility to SARS-CoV-2 of cell lines and substrates used to diagnose and isolate influenza and other viruses. Total viral RNA levels determined by real-time reverse transcription PCR (standard curve generated by synthetic RNA) from RNA extracted from cell lines inoculated with USA-WA1 at MOI 0.1 in 6-well plates. Data points at 1 h represented by RNA from the inoculum; >2 h time points from RNA extracted from cell lysates. Data are mean of n = 3 +SD.
Page created: February 24, 2021
Page updated: April 20, 2021
Page reviewed: April 20, 2021
The conclusions, findings, and opinions expressed by authors contributing to this journal do not necessarily reflect the official position of the U.S. Department of Health and Human Services, the Public Health Service, the Centers for Disease Control and Prevention, or the authors' affiliated institutions. Use of trade names is for identification only and does not imply endorsement by any of the groups named above.