Skip directly to site content Skip directly to page options Skip directly to A-Z link Skip directly to A-Z link Skip directly to A-Z link

Disclaimer: Early release articles are not considered as final versions. Any changes will be reflected in the online version in the month the article is officially released.

Volume 31, Number 8—August 2025

Research

Rapid Emergence and Evolution of SARS-CoV-2 Intrahost Variants among COVID-19 Patients with Prolonged Infections, Singapore

Yvonne C.F. SuComments to Author , Michael A. Zeller, Peter Cronin, Rong Zhang, Yan Zhuang, Jordan Ma, Foong Ying Wong, Giselle G.K. Ng, Áine O’Toole, Andrew Rambaut, Jenny G. Low, and Gavin J.D. Smith
Author affiliation: Programme in Emerging Infectious Diseases, Duke-NUS Medical School, Singapore (Y.C.F. Su, M.A. Zeller, P. Cronin, R. Zhang, Y. Zhang, J. Ma, F.Y. Wong, G.G.K. Ng, J.G. Low, G.J.D. Smith); Institute of Evolutionary Biology, University of Edinburgh, Edinburgh, Scotland, UK (A. O’Toole, A. Rambaut); Singapore General Hospital, Singapore (J.G. Low)

Main Article

Figure 1

Distribution of iSNVs among patients in study of rapid emergence and evolution of SARS-CoV-2 intrahost variants among COVID-19 patients with prolonged infections, Singapore. A) Total number of iSNV detected in longitudinal samples from each patient, categorized as nonsynonymous or synonymous intrahost variants. B) Distribution plots of all iSNVs per kilobase among genes. Horizontal bars within boxes indicate medians; box tops and bottoms indicate upper and lower quartiles; vertical bars indicate minimum and maximum values. C) Overall iSNV counts across different genes with 5%­–95% frequency from longitudinal samples of all patients. D) Overall proportions of iSNVs among genes. E, envelope; iSNV, intrahost single-nucleotide variant; kb, kilobase; M, membrane; N, nucleocapsid; ORF, open reading frame; S, spike.

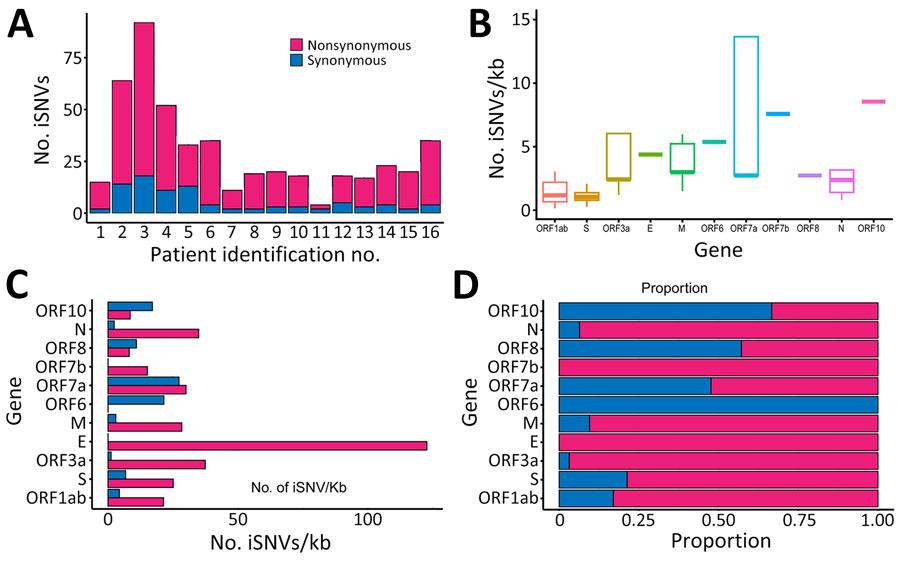
Figure 1. Distribution of iSNVs among patients in study of rapid emergence and evolution of SARS-CoV-2 intrahost variants among COVID-19 patients with prolonged infections, Singapore. A) Total number of iSNV detected in longitudinal samples from each patient, categorized as nonsynonymous or synonymous intrahost variants. B) Distribution plots of all iSNVs per kilobase among genes. Horizontal bars within boxes indicate medians; box tops and bottoms indicate upper and lower quartiles; vertical bars indicate minimum and maximum values. C) Overall iSNV counts across different genes with 5%­–95% frequency from longitudinal samples of all patients. D) Overall proportions of iSNVs among genes. E, envelope; iSNV, intrahost single-nucleotide variant; kb, kilobase; M, membrane; N, nucleocapsid; ORF, open reading frame; S, spike.

Main Article

Page created: May 31, 2025
Page updated: July 01, 2025
Page reviewed: July 01, 2025
The conclusions, findings, and opinions expressed by authors contributing to this journal do not necessarily reflect the official position of the U.S. Department of Health and Human Services, the Public Health Service, the Centers for Disease Control and Prevention, or the authors' affiliated institutions. Use of trade names is for identification only and does not imply endorsement by any of the groups named above.
file_external