Maps & Travel Medicine
CDC Yellow Book 2024
IntroductionFor well over 50 years, the Centers for Disease Control and Prevention (CDC) has used maps to help communicate geographically nuanced information about travel-related disease risks and associated health and safety recommendations. The earliest editions of CDC Yellow Book, a slim pamphlet entitled Immunization Information for International Travel, included reprints of maps produced by the World Health Organization showing areas of risk for malaria (Figure 1-01) and yellow fever (Figure 1-02). Although the number and variety of maps in the CDC Yellow Book have grown over the past 11 editions, from 7 in 2000 to 58 in 2020 (Figure 1-03), most still focus on identifying areas of risk for these same 2 diseases. Over time, as malaria prophylaxis and yellow fever vaccine recommendations for many destinations have become increasingly geographically specific, we have included additional country-specific reference maps in CDC Yellow Book (see Sec. 2, Ch. 5, Yellow Fever Vaccine & Malaria Prevention Information, by Country).
A well-designed map speaks for itself, even when depicting complex features of a disease. Public health maps must accurately reflect the subject matter expert’s judgment on best available evidence and clinical practices. CDC Yellow Book maps are subject to multiple constraints, including the spatial and temporal precision of reported disease surveillance data, variation in how data are reported, and the availability of corresponding environmental and demographic data. Decisions also must be made about whether including a map provides additional clarity. For some health risks, a table or textual description is adequate. When vaccination or prophylaxis recommendations apply to an entire country, for example, a map might be unnecessary. Conversely, when risk or recommendations vary based on geographic boundaries that are difficult to describe in words, maps can enhance risk communication, orienting the viewer more quickly and efficiently than a table or text.
Figure 1-01. Reprint of malaria map from Health Information for International Travel 1974 (CDC 1974)
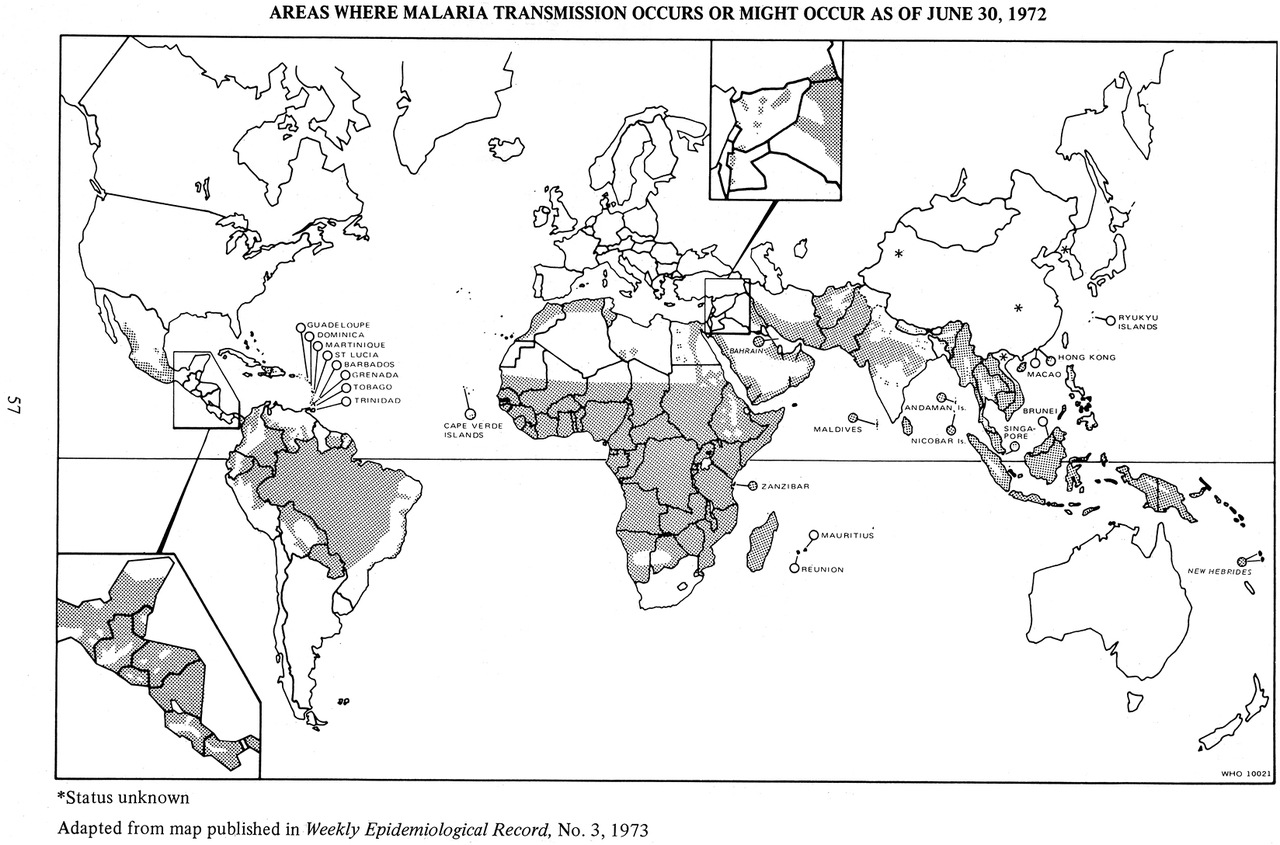
For many years, CDC Yellow Book included World Health Organization global malaria maps, which generally followed the above design style. Small size and lack of labels made these maps difficult to interpret for specific travel itineraries.
Figure 1-02. Reprint of yellow fever endemic zones map from Health Information for International Travel 1977 (CDC 1977)
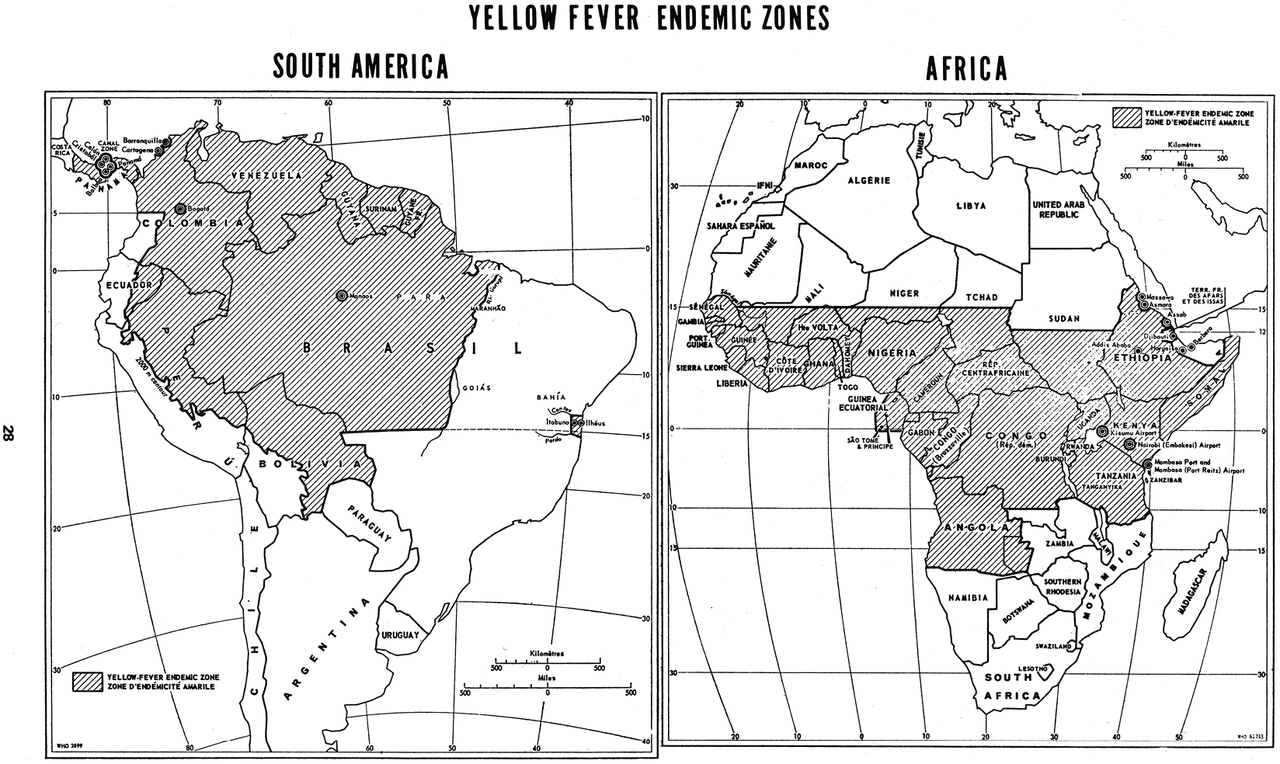
These World Health Organization maps highlight various ways that boundaries of vectorborne diseases (e.g., yellow fever) can be demarcated. Compare these maps to the most current yellow fever vaccine recommendations in this edition of CDC Yellow Book (see Section 5.2.26, Yellow Fever).
Figure 1-03. Number of maps included in CDC Yellow Book (YB) print editions, 2000–20241,2
Over the past 11 editions, the number of CDC YB maps has increased by approximately 10-fold. Many new country-specific malaria and yellow fever risk maps aid in the interpretation of prophylaxis and vaccination recommendations.
1 YB2022 not published due to the coronavirus disease 2019 pandemic.
2 Created to supplement written information that appeared in the YB chapter, Yellow Fever Vaccine & Malaria Prevention Information, by Country, reference maps showed cities and provinces of selected countries. It was left to the reader to review these maps along with the written information in the chapter to determine where travelers could be at risk for yellow fever virus and/or malaria transmission. Starting in 2014, YB began replacing reference maps with disease-specific maps depicting risk areas for yellow fever virus and malaria transmission. The last reference map (China) appeared in YB2020.
In addition to providing vaccination and prophylaxis recommendations, other categories of CDC Yellow Book maps include destination maps, disease distribution maps, and risk maps. The destination maps in Section 10, Popular Itineraries, are included to provide information about the locations of national parks, game preserves, cities, and culturally significant gathering places. These maps serve as visual references to help clinicians understand their patients’ travel plans. Disease distribution maps found throughout Section 5, Travel-Associated Infections & Diseases, show the global or regional presence or burden of the diseases described. Disease mapping varies, however. In some cases, a disease prevalence map could be most useful to a clinician; in other instances, risk maps, depicting both disease distribution and other relevant factors (e.g., elevation or access to preventative measures) can help health care providers make specific recommendations. Diseases with complex geographic variation in both prevalence and preventative measures also might have corresponding prophylaxis recommendation maps.
All the static maps from the print edition of CDC Yellow Book are available on the Travelers’ Health website but advances in online mapping technology have created opportunities to deliver travel health information in novel ways. In March 2017, for example, CDC’s Travelers’ Health Branch launched a mapping application to aid in the communication of international Zika travel recommendations. This application allows users to search an interactive map; clicking on a destination opens a text box that provides travel health information for the specific location. CDC created a similar map for the coronavirus disease 2019 (COVID-19) pandemic. Efforts are under way to create interactive maps for the online version of CDC Yellow Book that will elucidate the geographic health risks associated with international travel, beyond malaria and yellow fever.
[ERROR:BlockContentError. BlockNameCHECK]